R语言 如何绘制泊松密度曲线
在这篇文章中,我们将学习如何在R编程语言中绘制泊松密度曲线。
使用的函数 。
dpois(): dpois()方法是用来接受量值向量和平均值向量作为输入参数。dpois()方法的语法如下。
语法:dpois (q, m)
参数 :
- q – 量值向量。
- m – 均值的矢量。
计算向量的泊松密度曲线
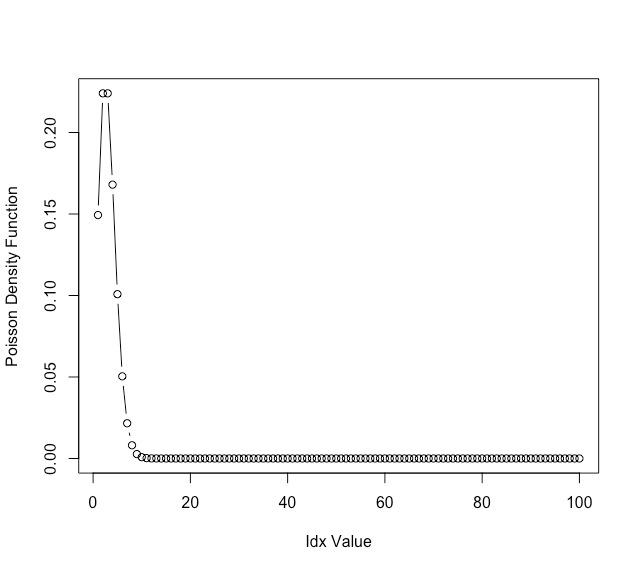
为了画出向量的泊松密度曲线,首先我们要声明从1到100的数据点,并指定lambda值为3,然后使用plot()方法将泊松密度曲线绘制在图形上,其中有dpois()方法来接受向量的量值。
# Declaring the data points
# from 1 to 100
data_points <-1:100
print(data_points)

# Specifying the lambda value
val <- 3

# Plotting the data points
plot(dpois(x= data_points,lambda= val),type="b",
     xlab = "Idx Value",
     ylab = "Poisson Density Function")
输出 。
> print(data_points)

[1] 1 2 3 4 5 6 7 8 9 10 11 12 13 14 15 16 17 18 19 20 21 22 23 24

[25] 25 26 27 28 29 30 31 32 33 34 35 36 37 38 39 40 41 42 43 44 45 46 47 48

[49] 49 50 51 52 53 54 55 56 57 58 59 60 61 62 63 64 65 66 67 68 69 70 71 72

[73] 73 74 75 76 77 78 79 80 81 82 83 84 85 86 87 88 89 90 91 92 93 94 95 96

[97] 97 98 99 100

计算矩阵的泊松分布函数
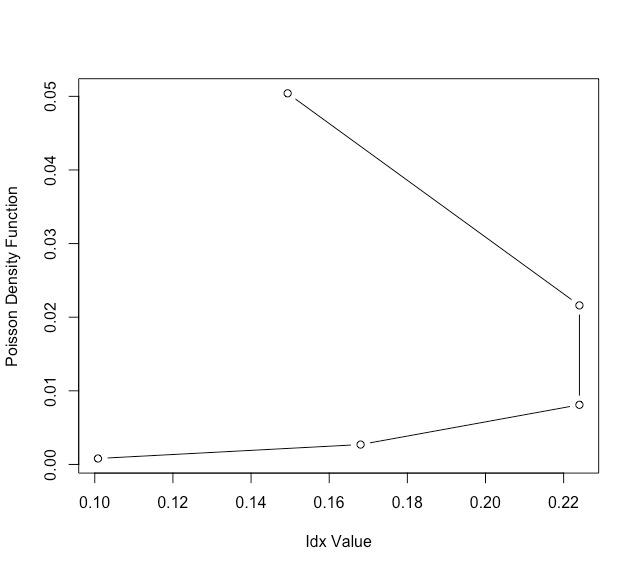
在这里,我们要创建数据点的矩阵,用它们来绘制泊松密度曲线,与上图相同。
# Declaring the data points
data_points <-matrix(1:20,ncol=4)
print(data_points)
# Specifying the lambda value
val<- 3
# Plotting the data points
plot(dpois(x= data_points,lambda= val),type="b",
     xlab = "Idx Value",
     ylab = "Poisson Density Function")
输出 。
> print(data_points)

[,1] [,2] [,3] [,4]

[1,] 1 6 11 16

[2,] 2 7 12 17

[3,] 3 8 13 18

[4,] 4 9 14 19

[5,] 5 10 15 20

 极客教程
极客教程