R语言 如何创建两个变量的柱状图
在这篇文章中,我们将讨论如何在R编程语言中创建两个变量的柱状图。
方法1:用基础R创建两个变量的直方图
在这种方法中,为了创建两个变量的直方图,用户需要调用hist()函数两次,因为有两个变量,在第二个hist()函数中,用户需要使用这个函数的特殊参数’add’,不同变量的直方图都会被绘制在一个图上。
语法 。
hist(x, col = NULL, add=true)
参数 。
- x:需要绘制直方图的值的向量。
- col:用于填充柱状图的颜色
- add:用于合并直方图。
例子 。
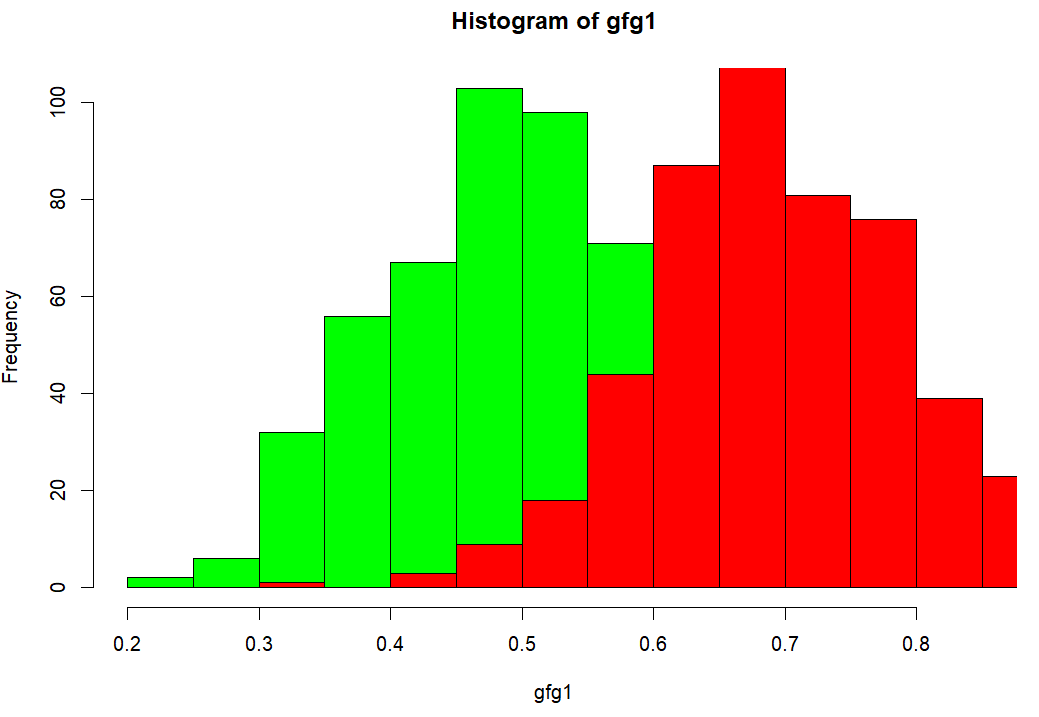
在这个例子中,我们将使用hist()函数创建直方图,将带有500个条目的随机数据点的变量放入同一个图中。
# Variable-1 with 500 random data points
gfg1<-rnorm(500,mean=0.5,sd=0.1)

# Variable-2 with 500 random data points
gfg2<-rnorm(500,mean=0.7,sd=0.1)

# histogram of variable-1
hist(gfg1,col='green')

# histogram of variable-2
hist(gfg2,col='red',add=TRUE)
输出 。
方法2:用ggplot2包创建两个变量的柱状图
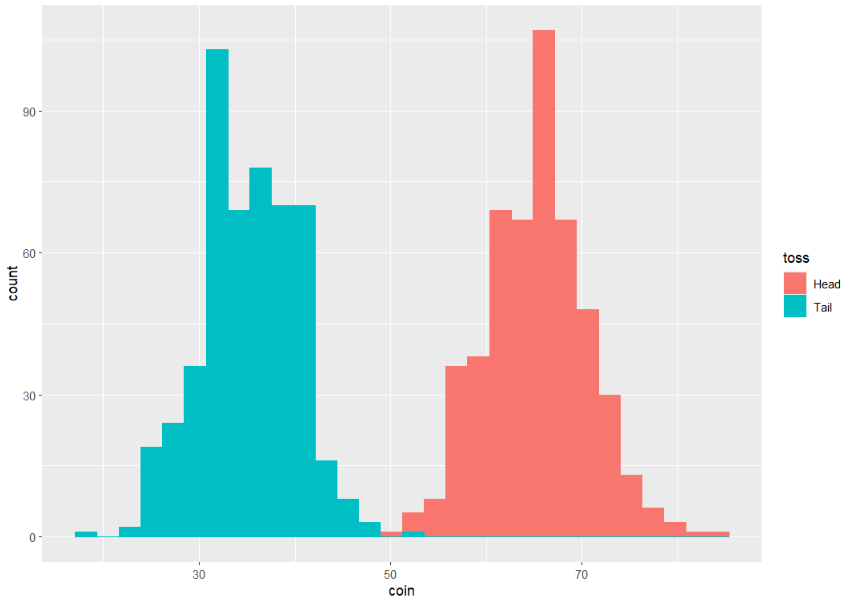
在这个方法中,为了创建两个变量的直方图,用户必须首先安装和导入ggplot2包,然后根据要求用指定的参数调用geom_histrogram,并需要在R编程语言中用我们需要直方图的变量创建数据框。
要安装和导入ggplot2包, 用户需要使用以下语法 。
Install – install.package(‘ggplot2’)
Import – library(ggplot2)
例子 。
# load the package
library(ggplot2)

# create a dataframe
# with mean and standard deviation
gfg < - data.frame(toss=factor(rep(c("Head", "Tail"), each=500)),
                   coin=round(c(rnorm(500, mean=65, sd=5),
                                rnorm(500, mean=35, sd=5))))

# plot the data using ggplot
ggplot(gfg, aes(x=coin, fill=toss, color=toss)) +
geom_histogram(position="identity")
输出 。
 极客教程
极客教程
