R语言 如何为ggvis添加一个图的标题
在这篇文章中,我们将探讨在R编程语言中为ggvis包添加绘图标题的方法。
R语言中的ggvis包是用来提供数据可视化的。它被用来创建可视化的交互式图形工具,用于数据的绘制和表示。该包可以通过以下命令安装到工作空间中。
install.packages("ggvis")
ggvis软件包中的ggvis方法启动了ggvis图形窗口。ggvis方法的语法如下。ggvis方法用于启动ggvis图形化窗口。ggvis方法的语法如下。
ggvis( data , mp1, mp2.,)
参数 :
- data – 要绘制的数据集
- mp1, mp2,… – 要绘制的地图变量
然后添加add_axis方法,为绘制的图形的坐标轴提供标签。它可以用来覆盖坐标轴的默认值。
add_axis ( vis, axes , title )
参数。
- vis – 用于绘图的ggvis对象
- axes – 用于绘图的坐标轴
- title – 轴的标题
如果需要,还可以添加其他可视化参数,以提高输出的可读性。例如,轴的标题可以放置在一个特定的方向位置。
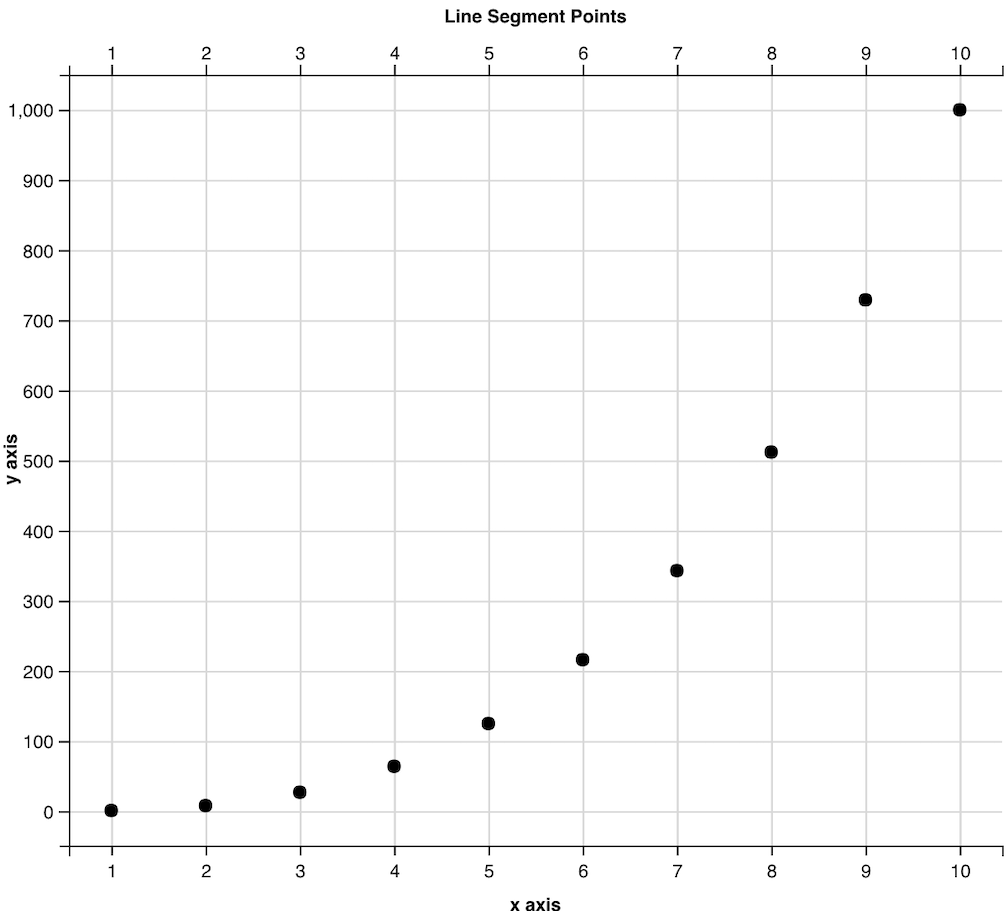
下面的代码片断用于在x和y轴以及沿x方向的图形顶部添加一个轴的标题。方向被设置为顶部,标题为 “线段点”。
# installing the required libraries
library(ggplot2)
library(ggvis)

# creating the data frame by defining
# the x and y coordinates respectively
data_frame < - data.frame(
    x_pos=1: 10,
    y_pos < - x ^ 3
)
print("Data Frame")
print(data_frame)

data_frame % > % ggvis(~x_pos, ~y_pos) % > % layer_points() % >%

# adding the plot title for x axis
add_axis("x", title="x axis") % >%

# adding the plot title for y axis
add_axis("y", title="y axis") % >%

# adding the plot title on the top of the graph
add_axis("x", orient="top", title="Line Segment Points")
输出
[1] "Data Frame"
> print(data_frame)
  x_pos y_pos....x.3
1      1            1
2      2            8
3      3           27
4      4           64
5      5          125
6      6          216
7      7          343
8      8          512
9      9          729
10    10         1000

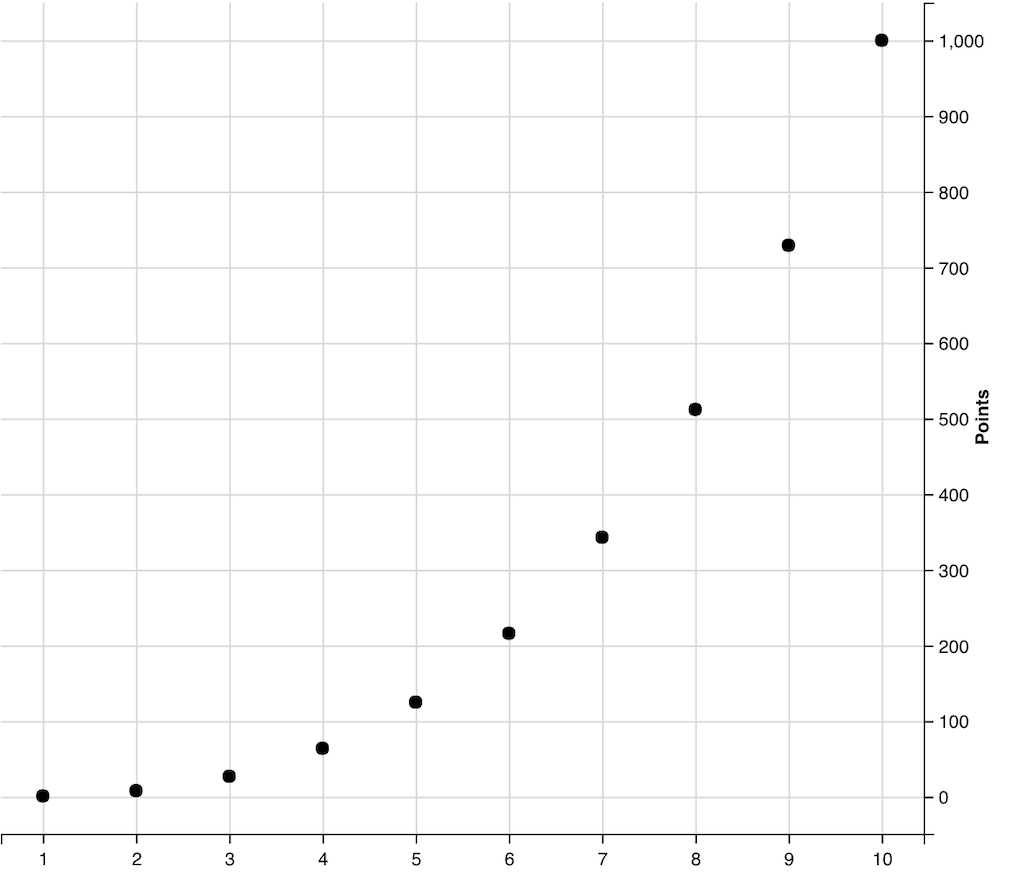
方向也可以跨Y轴设置,方向设置为右。默认的方向是沿Y轴向左。
# installing the required libraries
library(ggplot2)
library(ggvis)

# creating the data frame by defining
# the x and y coordinates respectively
data_frame < - data.frame(
    x_pos=1: 10,
    y_pos < - x ^ 3
)
print("Data Frame")
print(data_frame)

data_frame % > % ggvis(~x_pos, ~y_pos) % > % layer_points() % >%

# adding the plot title on the right of
# the graph along the y axis direction
add_axis("y", orient="right", title="Points")
输出
[1] "Data Frame"
> print(data_frame)
 x_pos y_pos....x.3
1      1            1
2      2            8
3      3           27
4      4           64
5      5          125
6      6          216
7      7          343
8      8          512
9      9          729
10    10         1000

 极客教程
极客教程