如何在 Python Plotly 中在悬停时突出显示一组中的所有值?
Plotly 具有分组数据值的功能。您还可以在悬停时突出显示一组中的所有值。在本教程中,我们将使用 plotly.io 生成图形。它包含许多自定义图表的方法。
按照以下步骤突出显示一组中的所有值。
步骤 1
导入 plotly.io 模块并将其别名为 pio 。
import plotly.io as pio步骤 2
创建一个值列表以形成字典。
fonts = ['Arial', 'Arial', 'Courier', 'Arial', 'Courier', 'Arial']
shade = ['bold','bold','italic','italic','bold','bold']
score = [1,2,3,4,5,6]
步骤 3
根据 X 和 Y 轴坐标值创建散点图,并应用 groupby 于 fonts,并为值的字典设置样式。
数据 = [dict(
   类型 = 'scatter',
   x = shade,
   y = score,
   模式 = 'markers',
   转换 = [dict(
      类型 = 'groupby',
      组 = fonts,
      样式 = [
         dict(target = 'Arial', value = dict(marker = dict(color = '蓝色'))),
         dict(target = 'Courier', value = dict(marker =
         dict(color = '红色'))),
         dict(target = '加粗', value = dict(marker = dict(color = '黑色'))),
         dict(target = '斜体', value = dict(marker =
         dict(color = '绿色')))
      ]
   )]
)]
第四步
让我们使用值字典生成图形并绘制图形。如下所示,
fig_dict = dict(data=data)
pio.show(fig_dict, validate=False)
例子
以下是突出显示悬停组中的所有值的完整代码:
import plotly.io as pio

fonts = ['Arial', 'Arial', 'Courier', 'Arial', 'Courier', 'Arial']
shade = ['bold','bold','italic','italic','bold','bold']
score = [1,2,3,4,5,6]

data = [dict(
   type = 'scatter',
   x = shade,
   y = score,
   mode = 'markers',
   transforms = [dict(
      type = 'groupby',
      groups = fonts,
      styles = [
         dict(target = 'Arial', value = dict(marker = dict(color = 'blue'))),
         dict(target = 'Courier', value = dict(marker =
         dict(color = 'red'))),
         dict(target = 'bold', value = dict(marker = dict(color = 'black'))),
         dict(target = 'italic', value = dict(marker =
         dict(color = 'green')))
      ]
   )]
)]

fig_dict = dict(data=data)
pio.show(fig_dict, validate=False)
输出
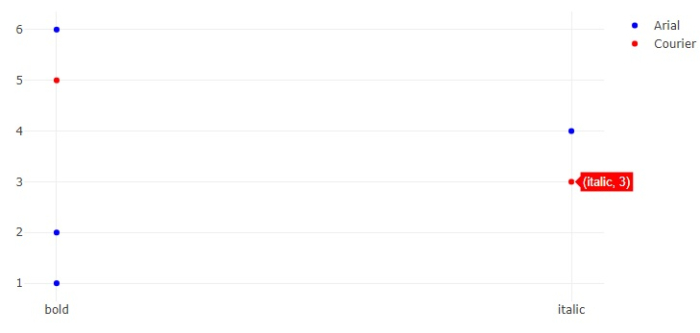
在浏览器上会显示以下输出: −

注意,当您将鼠标悬停在一个点上时,它将突出显示其所有值。
 极客教程
极客教程