Pandas 操作数据,本章介绍Pandas如何操作数据,包括统计函数(mean()),应用函数(Apply()),直方图化(value_counts()),字符串方法(str.lower())。
统计函数
在一些操作中经常会排除缺失值,进行描述性统计,如下例所示:
import numpy as np
import pandas as pd
dates = pd.date_range('20130101', periods=6)
df = pd.DataFrame(np.random.randn(6, 4), index=dates, columns=list('ABCD'))
print(df.mean())
输出结果:

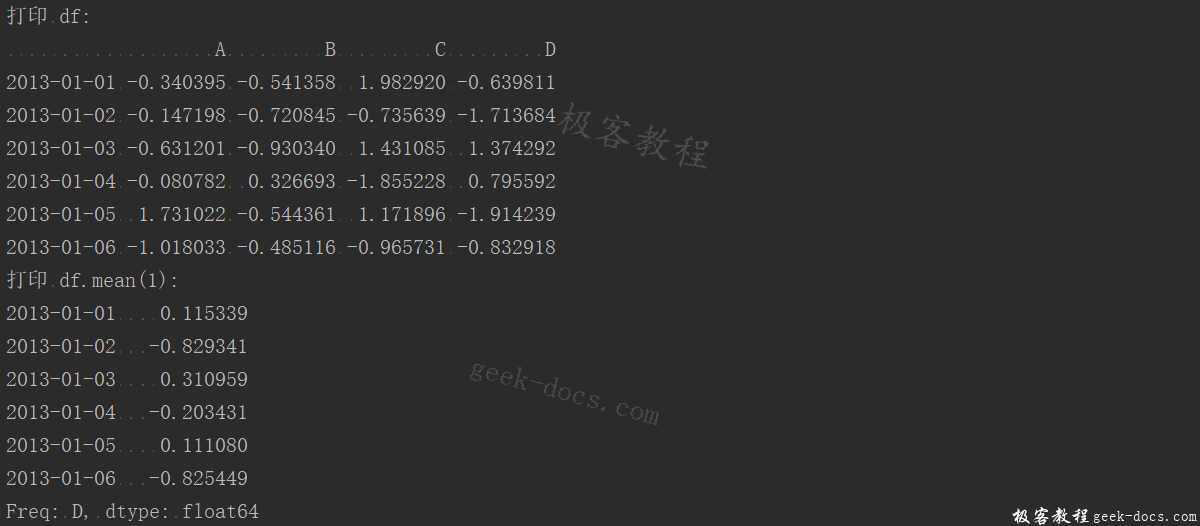
在其它轴(行)上进行相同的操作:
import numpy as np
import pandas as pd
dates = pd.date_range('20130101', periods=6)
df = pd.DataFrame(np.random.randn(6, 4), index=dates, columns=list('ABCD'))
print("打印 df:")
print(df)
print("打印 df.mean(1):")
print(df.mean(1))
输出结果为:

使用具有不同维度且需要对齐的对象进行操作,Pandas会自动沿指定维度进行广播。
import numpy as np
import pandas as pd
dates = pd.date_range('20130101', periods=6)
df = pd.DataFrame(np.random.randn(6, 4), index=dates, columns=list('ABCD'))
s = pd.Series([1, 3, 5, np.nan, 6, 8], index=dates).shift(2)
print("s 输出结果为:")
print(s)
print("df.sub 输出结果为:")
print(df.sub(s, axis='index'))
输出结果为:
s 输出结果为:
2013-01-01    NaN
2013-01-02    NaN
2013-01-03    1.0
2013-01-04    3.0
2013-01-05    5.0
2013-01-06    NaN
Freq: D, dtype: float64
df.sub 输出结果为:
                   A         B         C         D
2013-01-01       NaN       NaN       NaN       NaN
2013-01-02       NaN       NaN       NaN       NaN
2013-01-03 -1.311284 -1.669125 -1.255036 -1.412873
2013-01-04 -2.647689 -1.355214 -1.054676 -3.222003
2013-01-05 -5.468917 -4.175048 -4.988819 -5.279922
2013-01-06       NaN       NaN       NaN       NaN
应用函数
将函数应用于数据,如下所示:
import numpy as np
import pandas as pd
dates = pd.date_range('20130101', periods=6)
df = pd.DataFrame(np.random.randn(6, 4), index=dates, columns=list('ABCD'))
print("df 输出结果为:")
print(df)
print("df.apply cumsum 输出结果为:")
print(df.apply(np.cumsum))
print("df.apply lambda 输出结果为:")
print(df.apply(lambda x: x.max() - x.min()))
输出结果如下:
df 输出结果为:
                   A         B         C         D
2013-01-01 -1.019257 -1.430405  0.174196  0.381940
2013-01-02  0.019061 -0.961388  0.326351  1.643811
2013-01-03  0.826624  1.440803  0.845878  0.826113
2013-01-04 -0.854414 -0.603850  2.616682  0.703454
2013-01-05 -2.004241  1.591384  0.188479 -1.542703
2013-01-06  0.214817  1.521112  1.049684 -0.833842
df.apply cumsum 输出结果为:
                   A         B         C         D
2013-01-01 -1.019257 -1.430405  0.174196  0.381940
2013-01-02 -1.000196 -2.391793  0.500547  2.025750
2013-01-03 -0.173573 -0.950990  1.346425  2.851864
2013-01-04 -1.027987 -1.554840  3.963107  3.555317
2013-01-05 -3.032227  0.036544  4.151586  2.012615
2013-01-06 -2.817411  1.557655  5.201270  1.178773
df.apply lambda 输出结果为:
A    2.830865
B    3.021788
C    2.442486
D    3.186513
dtype: float64
直方图化
import numpy as np
import pandas as pd
dates = pd.date_range('20130101', periods=6)
df = pd.DataFrame(np.random.randn(6, 4), index=dates, columns=list('ABCD'))
s = pd.Series(np.random.randint(0, 7, size=10))
print("s 输出结果为:")
print(s)
print("s.value_counts 输出结果为:")
print(s.value_counts())
输出结果为:
s 输出结果为:
0    3
1    3
2    4
3    6
4    5
5    6
6    1
7    2
8    5
9    1
dtype: int32
s.value_counts 输出结果为:
6    2
5    2
3    2
1    2
4    1
2    1
dtype: int64
字符串方法
Series在str属性中配备了一组字符串处理方法,可以轻松地对数组的每个元素进行操作,如下面的代码片段所示。 请注意,str中的模式匹配中默认情况下通常使用正则表达式
import numpy as np
import pandas as pd
dates = pd.date_range('20130101', periods=6)
df = pd.DataFrame(np.random.randn(6, 4), index=dates, columns=list('ABCD'))
s = pd.Series(['A', 'B', 'C', 'Aaba', 'Baca', np.nan, 'CABA', 'dog', 'cat'])
print("s 输出结果为:")
print(s)
print("s.str.lower 输出结果为:")
print(s.str.lower())
输出结果为:
s 输出结果为:
0       A
1       B
2       C
3    Aaba
4    Baca
5     NaN
6    CABA
7     dog
8     cat
dtype: object
s.str.lower 输出结果为:
0       a
1       b
2       c
3    aaba
4    baca
5     NaN
6    caba
7     dog
8     cat
dtype: object
 极客教程
极客教程