NumPy.histogram()方法在Python中的应用
直方图是可视化数据集频率分布的最佳方式,它将数据集分割成大小相等的小区间,称为Bin。Numpy直方图函数与matplotlib库的hist()函数类似,唯一的区别是Numpy直方图给出了数据集的数字表示,而hist()给出了数据集的图形表示。
创建Numpy直方图
Numpy有一个内置的numpy.histogram()函数,以图形的形式表示数据分布的频率。具有相同水平尺寸的矩形对应于称为bin的类区间,可变高度对应于频率。
语法:
numpy.histogram(data, bins=10, range=None, normed=None, weights=None, density=None)
上述功能的属性列举如下。
| 属性 | 参数 |
|---|---|
| 数据 | 要绘制的数组或数组的序列 |
| bins | int或字符串序列,定义了一个范围内等宽的bin的数量,默认为10。 |
| range | 可选的参数,设置分层的下限和上限范围 |
| normed | 可选参数,与密度属性相同,对不等的bin宽度给出不正确的结果。 |
| weights | 可选参数,定义权重数组,尺寸与数据相同。 |
| 密度 | 可选参数,如果为假,结果包含每个仓的样本数,如果为真,结果包含仓的概率密度函数。 |
该函数有两个返回值hist和edge_bin,前者给出直方图的数值数组,后者是一个浮动数据类型的数组,包含长度比hist多一个的bin边缘。
示例:
# Import libraries
import numpy as np


# Creating dataset
a = np.random.randint(100, size =(50))

# Creating histogram
np.histogram(a, bins = [0, 10, 20, 30, 40,
                        50, 60, 70, 80, 90,
                        100])

hist, bins = np.histogram(a, bins = [0, 10,
                                     20, 30,
                                     40, 50,
                                     60, 70,
                                     80, 90,
                                     100])

# printing histogram
print()
print (hist)
print (bins)
print()
输出:

图像表示
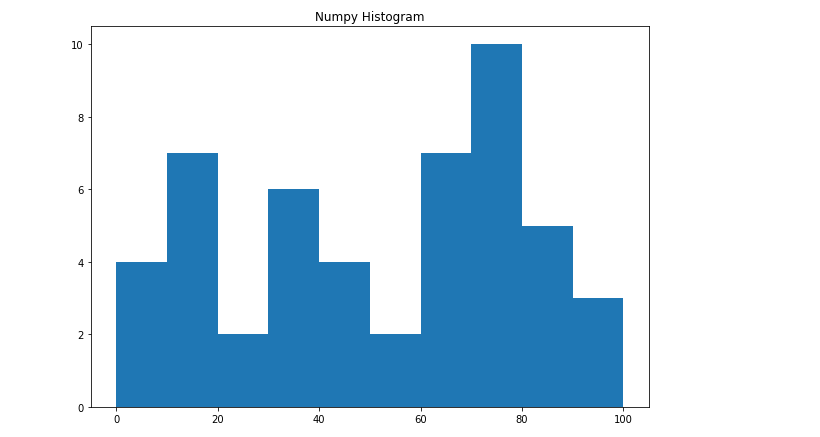
上述直方图的数字表示可以转换为图形形式。Matplotlib的pyplot子模块中的plt()函数以数据集数组和bin数组为参数,创建相应数据值的直方图。
示例:
# import libraries
from matplotlib import pyplot as plt
import numpy as np


# Creating dataset
a = np.random.randint(100, size =(50))

# Creating plot
fig = plt.figure(figsize =(10, 7))

plt.hist(a, bins = [0, 10, 20, 30,
                    40, 50, 60, 70,
                    80, 90, 100])

plt.title("Numpy Histogram")

# show plot
plt.show()
输出:

 极客教程
极客教程