重采样时间序列数据,本章我们将学习怎样使用Pandas重采样时间序列数据。
具体步骤
我们将下载AAPL股票每日股价的时间序列数据,然后通过计算平均值的方式,对这些数据做重采样处理。为此,我们将创建一个Pandas的DataFrame对象,并调用它的resample方法。
- 创建一个日期时间索引对象。
在创建Pandas的DataFrame对象之前,需要先创建一个日期时间索引(DatetimeIndex)对象。这个DatetimeIndex对象将被作为索引传递给DataFrame的构造函数。用如下语句从下载的股价数据创建日期时间索引对象。
dt_idx = pandas.DatetimeIndex(quotes.date)
- 创建
DataFrame对象。
用日期时间索引对象和收盘价数据创建一个DataFrame对象。
df = pandas.DataFrame(quotes.close, index=dt_idx,
  columns=[symbol])
- 重采样。
以每月一次的频率,通过计算平均值的方式,重采样时间序列数据。
resampled = df.resample('M', how=numpy.mean)
print resampled
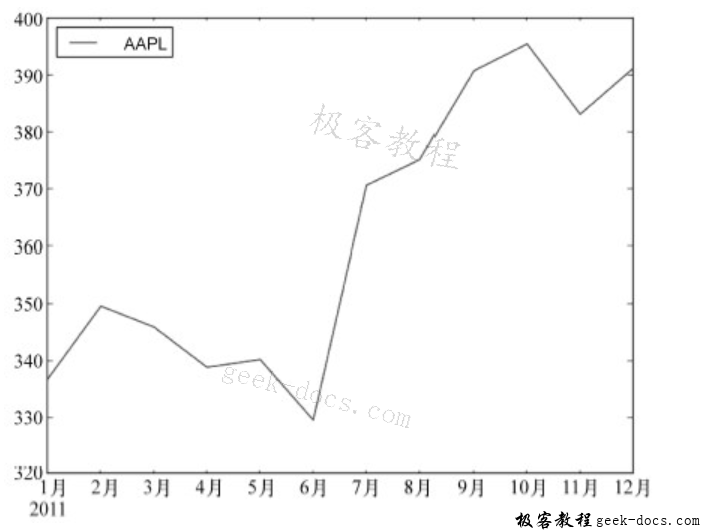
重采样后的时间序列中,每月只有一个数据,如下所示。
AAPL
2011-01-31 336.932500
2011-02-28 349.680526
2011-03-31 346.005652
2011-04-30 338.960000
2011-05-31 340.324286
2011-06-30 329.664545
2011-07-31 370.647000
2011-08-31 375.151304
2011-09-30 390.816190
2011-10-31 395.532381
2011-11-30 383.170476
2011-12-31 391.251429
- 绘图。
用DataFrame的plot方法,绘制数据。
df.plot()
resampled.plot()
show()
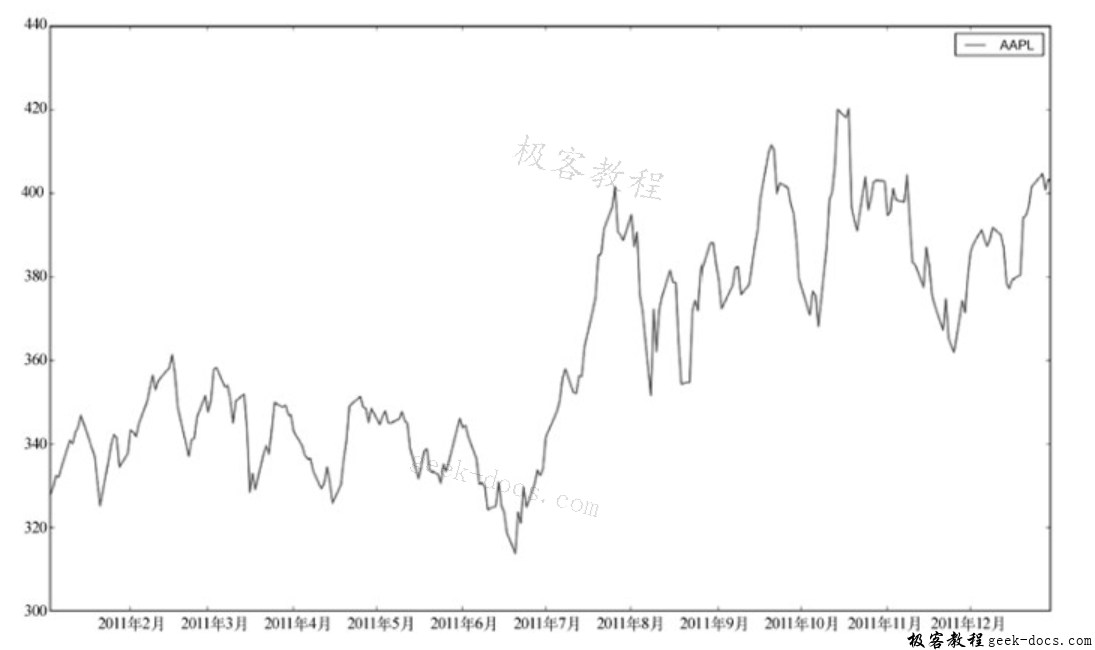
用原始时间序列绘图后的结果如下图所示。

重采样后的时间序列数据点较少,因此用该序列绘制的曲线看上去不太连贯,如下图所示。

完整的重采样代码如下。
import pandas
from matplotlib.pyplot import show, legend
from datetime import datetime
from matplotlib import finance
import numpy

# 下载2011年到2012年的AAPL股价数据
start = datetime(2011, 01, 01)
end = datetime(2012, 01, 01)

symbol = "AAPL"
quotes = finance.quotes_historical_yahoo(symbol, start, end, asobject=True)

# 创建日期时间索引对象
dt_idx = pandas.DatetimeIndex(quotes.date)

# 创建DataFrame对象
df = pandas.DataFrame(quotes.close, index=dt_idx, columns=[symbol])

# 以每月一次的频率重采样
resampled = df.resample('M', how=numpy.mean)
print resampled

# 绘图
df.plot()
resampled.plot()
show()
攻略小结
我们用日期和时间列表,创建了一个日期时间索引对象。该索引对象被用来创建Pandas的DataFrame对象。我们对时间序列数据进行了重采样,重采样的频率通过一个单字符的参数给出:
- D,每天一次
- M,每月一次
- A,每年一次
resample方法中的how参数指明了具体的重采样方式,默认的重采样方式是计算平均值。
 极客教程
极客教程