Matplotlib 添加文本

Matplotlib 添加文本,本文介绍如何为图表添加文字标签,极客教程前面章节介绍标题的添加方法,使用title()函数即可。另外xlabel()ylabel()函数专门用于添加轴标签,text()函数允许在图表任意位置添加文本。

xlabel() 和 ylabel() 函数

如果需要为图表的x轴和y轴添加文本标签,xlabel()ylabel()函数专门用于添加轴标签,把要显示的文本以字符串形式传给这两个函数作为参数。

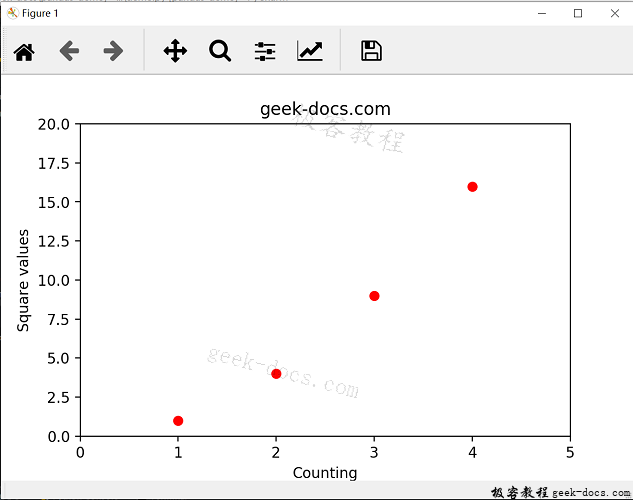
现在把两条轴的标签添加到图表中,它们描述的是坐标轴数值的含义,如下所示:

import matplotlib.pyplot as plt


plt.axis([0,5, 0, 20])
plt.title("geek-docs.com")
plt.xlabel('Counting')
plt.ylabel('Square values')
plt.plot([1,2,3,4], [1,4,9,16], 'ro')
plt.show()

输出结果如下:
Matplotlib 添加文本


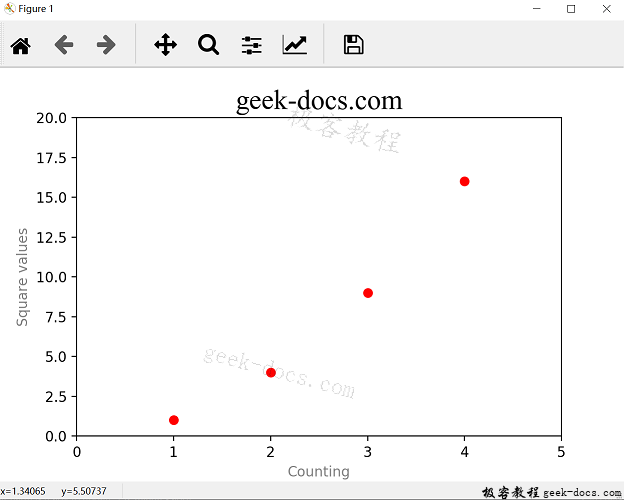
我们可以用关键字参数修改文本属性,例如,你可以修改标题的字体,使用更大的字号。你还可以指定轴标签的颜色为灰色,从而反衬出图形的标题。如下所示:

import matplotlib.pyplot as plt

plt.axis([0,5, 0, 20])
plt.title("geek-docs.com", fontsize=20, fontname="Times New Roman")
plt.xlabel('Counting', color = 'gray')
plt.ylabel('Square values', color = 'gray')
plt.plot([1,2,3,4], [1,4,9,16], 'ro')
plt.show()

输出结果为:
Matplotlib 添加文本

text() 函数

pyplot允许在图表任意位置添加文本,这个功能由text()函数来实现,函数定义如下:

text(x, y, s, fontdict=None, **kwargs)

前两个参数为文本在图形中位置的坐标,s为要添加的字符串,fontdict(可选)为文本要使用的字体。最后是关键字参数。

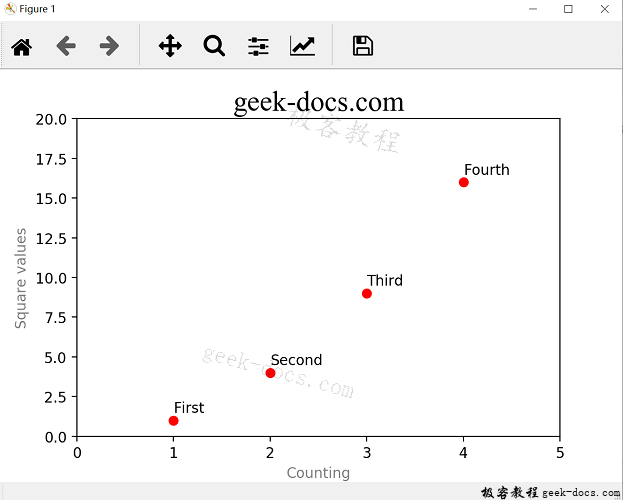
text()前两个参数为标签在图形中位置的坐标,我们可以使用四个数据点的坐标作为各标签的坐标,如下所示:


import matplotlib.pyplot as plt

plt.axis([0,5, 0, 20])
plt.title("geek-docs.com", fontsize=20, fontname="Times New Roman")
plt.xlabel('Counting', color = 'gray')
plt.ylabel('Square values', color = 'gray')
plt.text(1, 1.5, 'First')
plt.text(2, 4.5, 'Second')
plt.text(3, 9.5, 'Third')
plt.text(4, 16.5, 'Fourth')
plt.plot([1,2,3,4], [1,4,9,16], 'ro')
plt.show()

输出结果如下,每个数据点都带有一个描述其相关信息的标签。
Matplotlib 添加文本

LaTex表达式

Matplotlib 整合了LaTex表达式,支持在图表中插入数学表达式。将表达式内容置于两个$符号之间,可以在文本中添加Latex表达式。解释器会将符号之间的文本识别成LaTex表达式,把它们转换为数学表达式、公式、数学符号或希腊字母等。然后在图像中显示出来。通常,你需要在包含Latex表达式的字符串前添加r字符,表明它后面是原始文本,不能对其进行转义字符

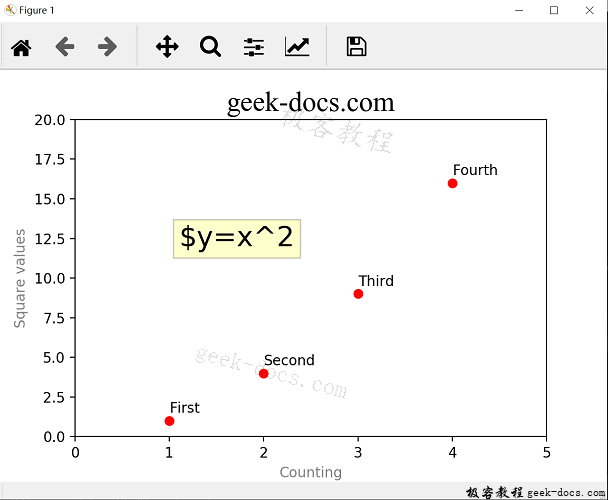
现在我们使用关键字参数进一步丰富图形中的文本,添加描述图形各数据点趋势的公式,并为公式添加一个彩色边框。如下所示:


import matplotlib.pyplot as plt

plt.axis([0,5, 0, 20])
plt.title("geek-docs.com", fontsize=20, fontname="Times New Roman")
plt.xlabel('Counting', color = 'gray')
plt.ylabel('Square values', color = 'gray')
plt.text(1, 1.5, 'First')
plt.text(2, 4.5, 'Second')
plt.text(3, 9.5, 'Third')
plt.text(4, 16.5, 'Fourth')
plt.text(1.1, 12, r'$y=x^2', fontsize=20, bbox={'facecolor':'yellow', 'alpha' : 0.2})
plt.plot([1,2,3,4], [1,4,9,16], 'ro')
plt.show()

输出结果如下:
Matplotlib 添加文本

相关文章推荐

Matplotlib Numpy
Matplotlib Pyplot
Matplotlib 安装教程


Matplotlib 教程
Matplotlib 教程Matplotlib 安装教程Matplotlib PyplotMatplotlib NumpyMatplotlib 添加文本Matplotlib 添加网格Matplotlib 添加图例Matplotlib 处理日期Matplotlib 线性图Matplotlib 直方图Matplotlib 条形图Matplotlib 水平条形图Matplotlib 饼图Matplotlib 等值线图Matplotlib 极区图Matplotlib 3D绘图Matplotlib教程Matplotlib - 简介Matplotlib - 环境搭建Matplotlib - Anaconda发行版Matplotlib - Jupyter笔记本Matplotlib - Pyplot APIMatplotlib - 简单绘图Matplotlib - PyLab模块Matplotlib - 面向对象的接口Matplotlib - 图形类Matplotlib - Axes类Matplotlib - 多图Matplotlib - Subplots()函数Matplotlib - Subplot2grid() 函数Matplotlib - 网格Matplotlib - 格式化坐标轴Matplotlib - 设置限制Matplotlib - 设置刻度线和刻度线标签Matplotlib - 双轴Matplotlib - 条形图Matplotlib - 柱状图Matplotlib - 饼图Matplotlib - 散点图Matplotlib - 等高线图Matplotlib - Quiver PlotMatplotlib - 箱形图Matplotlib - Violin PlotMatplotlib - 三维绘图Matplotlib - 三维等高线图Matplotlib - 3D线框图Matplotlib - 3D曲面图Matplotlib - 使用文本工作Matplotlib - 数学表达式Matplotlib - 使用图像工作Matplotlib - 变换
matplotlib.pyplot
matplotlib.pyplot.autumn()函数matplotlib.pyplot.axes()函数matplotlib.pyplot.axhline()函数matplotlib.pyplot.axhspan()函数matplotlib.pyplot.axis()函数matplotlib.pyplot.axvline()函数matplotlib.pyplot.axvspan()函数matplotlib.pyplot.barbs()函数matplotlib.pyplot.barh()函数matplotlib.pyplot.bone()函数matplotlib.pyplot.broken_barh()函数matplotlib.pyplot.cla()函数matplotlib.pyplot.clabel()函数matplotlib.pyplot.clf()函数matplotlib.pyplot.clim()函数matplotlib.pyplot.close()函数matplotlib.pyplot.cohere()函数matplotlib.pyplot.colorbar()函数matplotlib.pyplot.connect()函数matplotlib.pyplot.contour()函数matplotlib.pyplot.contourf()函数matplotlib.pyplot.cool()函数matplotlib.pyplot.copper()函数matplotlib.pyplot.csd()函数matplotlib.pyplot.delaxes()函数matplotlib.pyplot.disconnect函数matplotlib.pyplot.draw()函数matplotlib.pyplot.errorbar()函数matplotlib.pyplot.eventplot()函数matplotlib.pyplot.figimage()函数matplotlib.pyplot.figlegend()函数matplotlib.pyplot.fignum_exists()函数matplotlib.pyplot.figtext()函数matplotlib.pyplot.figure()函数matplotlib.pyplot.fill()函数matplotlib.pyplot.fill_between()函数matplotlib.pyplot.fill_betweenx()函数matplotlib.pyplot.findobj()函数matplotlib.pyplot.flag()函数matplotlib.pyplot.gca()函数matplotlib.pyplot.gcf()函数matplotlib.pyplot.gci()函数matplotlib.pyplot.get_current_fig_manager()函数matplotlib.pyplot.get_figlabels()函数matplotlib.pyplot.get_fignums()函数matplotlib.pyplot.get_plot_commands()函数matplotlib.pyplot.ginput()函数matplotlib.pyplot.gray()函数matplotlib.pyplot.grid()函数matplotlib.pyplot.hexbin()函数matplotlib.pyplot.hist()函数matplotlib.pyplot.hist2d()函数matplotlib.pyplot.hlines()函数matplotlib.pyplot.hot()函数matplotlib.pyplot.hsv()函数matplotlib.pyplot.imread()函数matplotlib.pyplot.imshow()函数matplotlib.pyplot.inferno()函数matplotlib.pyplot.ioff()函数matplotlib.pyplot.ion()函数matplotlib.pyplot.isinteractive()函数matplotlib.pyplot.jet()函数matplotlib.pyplot.legend()函数matplotlib.pyplot.locator_params()函数matplotlib.pyplot.loglog()函数matplotlib.pyplot.magma()函数matplotlib.pyplot.magnitude_spectrum()函数matplotlib.pyplot.margin()函数matplotlib.pyplot.matshow()函数matplotlib.pyplot.minorticks_off()函数matplotlib.pyplot.minorticks_on()函数matplotlib.pyplot.nipy_spectral()函数matplotlib.pyplot.pause()函数matplotlib.pyplot.pcolor()函数matplotlib.pyplot.pcolormesh()函数matplotlib.pyplot.phase_spectrum()函数matplotlib.pyplot.pink()函数matplotlib.pyplot.plasma()函数matplotlib.pyplot.plot()函数matplotlib.pyplot.plot_date()函数matplotlib.pyplot.polar函数matplotlib.pyplot.prism()函数matplotlib.pyplot.psd()函数matplotlib.pyplot.quiver()函数matplotlib.pyplot.rc()函数matplotlib.pyplot.rc_context()函数matplotlib.pyplot.rcdefaults()函数matplotlib.pyplot.savefig()函数matplotlib.pyplot.sca()函数matplotlib.pyplot.scatter()函数matplotlib.pyplot.sci()函数matplotlib.pyplot.semilogx()函数matplotlib.pyplot.semilogy()函数matplotlib.pyplot.set_cmap()函数matplotlib.pyplot.setp()函数matplotlib.pyplot.show()函数matplotlib.pyplot.specgram()函数matplotlib.pyplot.spring()函数matplotlib.pyplot.stackplot()函数matplotlib.pyplot.stem()函数matplotlib.pyplot.step()函数matplotlib.pyplot.streamplot()函数matplotlib.pyplot.subplot()函数matplotlib.pyplot.subplot2grid()函数matplotlib.pyplot.subplot_tool()函数matplotlib.pyplot.subplots()函数matplotlib.pyplot.subplots_adjust()函数matplotlib.pyplot.summer()函数matplotlib.pyplot.suptitle()函数matplotlib.pyplot.table()函数matplotlib.pyplot.text()函数matplotlib.pyplot.thetagrids()函数matplotlib.pyplot.tick_params()函数matplotlib.pyplot.tight_layout()函数matplotlib.pyplot.title()函数matplotlib.pyplot.tricontour()函数matplotlib.pyplot.tricontourf()函数matplotlib.pyplot.tripcolor()函数matplotlib.pyplot.triplot()函数matplotlib.pyplot.twinx()函数matplotlib.pyplot.twiny()函数matplotlib.pyplot.violinplot()函数matplotlib.pyplot.viridis()函数matplotlib.pyplot.vlines()函数matplotlib.pyplot.waitforbuttonpress()函数matplotlib.pyplot.winter()函数matplotlib.pyplot.xcorr()函数matplotlib.pyplot.xkcd()函数matplotlib.pyplot.xlabels()函数matplotlib.pyplot.xlim()函数matplotlib.pyplot.xscale()函数matplotlib.pyplot.xticks()函数matplotlib.pyplot.ylabel()函数matplotlib.pyplot.ylim()函数matplotlib.pyplot.yscale()函数matplotlib.pyplot.yticks()函数
matplotlib.axes
matplotlib.axes.SubplotBasematplotlib.axes.axes.plotmatplotlib.axes.axes.errorbarmatplotlib.axes.axes.scattermatplotlib.axes.axes.plot_datematplotlib.axes.axes.stepmatplotlib.axes.axes.loglogmatplotlib.axes.axes.semilogxmatplotlib.axes.axes.semilogymatplotlib.axes.axes.fill_betweenmatplotlib.axes.axes.fill_betweenxmatplotlib.axes.axes.barmatplotlib.axes.axes.barhmatplotlib.axes.axes.stemmatplotlib.axes.axes.eventplot()matplotlib.axes.axes.piematplotlib.axes.axes.stackplot()matplotlib.axes.axes.broken_barh()matplotlib.axes.axes.vlines()matplotlib.axes.axes.hlines()matplotlib.axes.axes.fill()matplotlib.axes.axes.axhline()matplotlib.axes.axes.axhspan()matplotlib.axes.axes.axvline()matplotlib.axes.axes.axvspan()matplotlib.axes.axes.acorr()matplotlib.axes.axes.angle_spectrum()matplotlib.axes.axes.cohere()matplotlib.axes.axes.csd()matplotlib.axes.axes.magnitude_spectrum()matplotlib.axes.axes.phase_spectrum()matplotlib.axes.axes.psd()matplotlib.axes.axes.specgram()matplotlib.axes.axes.xcorr()matplotlib.axes.axes.boxplot()matplotlib.axes.axes.bxp()matplotlib.axes.axes.hexbin()matplotlib.axes.axes.hist()matplotlib.axes.axes.hist2d()Matplotlib.axes.axes.clabel 函数Matplotlib.axes.axes.contourMatplotlib.axes.axes.contourf()Matplotlib.axes.axes.imshow()Matplotlib.axes.axes.matshow()Matplotlib.axes.axes.pcolor()Matplotlib.axes.axes.pcolorfast()Matplotlib.axes.axes.secondary_xaxis()Matplotlib.axes.axes.pcolormesh()Matplotlib.axes.axes.spy()Matplotlib.axes.axes.triplot()Matplotlib.axes.axes.tricontour()Matplotlib.axes.axes.tricontourf()Matplotlib.axes.axes.annotate()Matplotlib.axes.axes.text()Matplotlib.axes.axes.arrow()Matplotlib.axes.axes.inset_axes()Matplotlib.axes.axes.secondary_yaxis()Matplotlib.axes.axes.barbs()Matplotlib.axes.axes.quiver()Matplotlib.axes.axes.quiverkey()Matplotlib.axes.axes.streamplot()Matplotlib.axes.axes.cla()Matplotlib.axes.axes.table()Matplotlib.axes.axes.clear()Matplotlib.axes.axes.axis()Matplotlib.axes.axes.set_axis_off()Matplotlib.axes.axes.set_axis_on()Matplotlib.axes.axes.set_frame_on()Matplotlib.axes.axes.set_axisbelow()Matplotlib.axes.axes.get_axisbelow()Matplotlib.axes.axes.grid()Matplotlib.axes.axes.set_facecolor()Matplotlib.axes.axes.set_prop_cycle()Matplotlib.axes.axes.get_xaxis()Matplotlib.axes.axes.get_yaxis()Matplotlib.axes.axes.invert_xaxis()Matplotlib.axes.axes. xaxis_reversed()Matplotlib.axes.axes.invert_yaxis()Matplotlib.axes.axes. yaxis_reversed()Matplotlib.axes.axes.set_xlim()Matplotlib.axes.axes.get_xlim()Matplotlib.axes.axes.set_ylim()Matplotlib.axes.axes.get_ylim()Matplotlib.axes.axes.set_xbound()Matplotlib.axes.axes.get_xbound()Matplotlib.axes.axes.set_ybound()Matplotlib.axes.axes.get_ybound()Matplotlib.axes.axes.set_xlabel()Matplotlib.axes.axes.get_xlabel()Matplotlib.axes.axes.set_ylabel()Matplotlib.axes.axes.get_ylabel()Matplotlib.axes.axes.set_title()Matplotlib.axes.axes.get_title()Matplotlib.axes.axes.legend()Matplotlib.axes.axes.get_legend()Matplotlib.axes.axes.set_xscale()Matplotlib.axes.axes.set_yscale()Matplotlib.axes.axes.get_yscale()Matplotlib.axes.Axes.margins()Matplotlib.axes.axes.autoscale()Matplotlib.axes.axes.autoscale_view()Matplotlib.axes.axes.set_autoscale_on()Matplotlib.axes.axes.get_autoscale_on()Matplotlib.axes.axes.set_autoscalex_on()Matplotlib.axes.axes.get_autoscalex_on()Matplotlib.axes.axes.set_autoscaley_on()Matplotlib.axes.axes.set_aspect()Matplotlib.axes.axes.set_adjustable()Matplotlib.axes.axes.set_xticks()Matplotlib.axes.axes.get_xticks()Matplotlib.axes.axes.set_xticklabels()Matplotlib.axes.axes.get_xticklabels()Matplotlib.axes.axes.get_xmajorticklabels()Matplotlib.axes.axes.get_xminorticklabels()Matplotlib.axes.axes.get_xgridlines()Matplotlib.axes.axes.get_xticklines()Matplotlib.axes.axes.set_yticks()Matplotlib.axes.axes.get_yticks()Matplotlib.axes.axes.set_yticklabels()Matplotlib.axes.axes.get_yticklabels()Matplotlib.axes.axes.get_ymajorticklabels()Matplotlib.axes.axes.get_yminorticklabels()Matplotlib.axes.axes.get_ygridlines()Matplotlib.axes.axes.get_yticklines()Matplotlib.axes.axes.minorticks_off()Matplotlib.axes.axes.minorticks_on()Matplotlib.axes.axes.tick_params()Matplotlib.axes.axes.locator_params()Matplotlib.axis.axis.have_units()Matplotlib.axes.axes.add_artist()Matplotlib.axes.axes.add_collection()Matplotlib.axes.axes.add_line()Matplotlib.axes.axes.add_patch()Matplotlib.axes.axes.add_table()Matplotlib.axes.axes.twinx()matplotlib.axes.axes.twiny()Matplotlib.axes.axes.get_shared_x_axes()Matplotlib.axes.axes.get_shared_y_axes()Matplotlib.axes.axes.get_axes_locator()Matplotlib.axes.axes.set_xmargin()Matplotlib.axes.axes.set_ymargin()Matplotlib.axes.axes.set_axes_locator()Matplotlib.axes.axes.get_position()Matplotlib.axes.axes.set_position()Matplotlib.axes.axes.add_callback()Matplotlib.axes.axes.remove_callback()matplotlib.axes.axes.can_pan()Matplotlib.axes.axes.can_zoom()Matplotlib.axes.axes.get_navigate()Matplotlib.axes.axes.set_navigate()Matplotlib.axes.axes.get_navigate_mode()Matplotlib.axes.axes.set_navigate_mode()Matplotlib.axes.axes.start_pan()Matplotlib.axes.axes.drag_pan()Matplotlib.axes.axes.end_pan()Matplotlib.axes.axes.format_coord()Matplotlib.axes.axes.format_cursor_data()Matplotlib.axes.axes.format_xdata()Matplotlib.axes.axes.format_ydata()Matplotlib.axes.axes.get_children()Matplotlib.axes.axes.contains_point()Matplotlib.axes.axes.get_images()Matplotlib.axes.axes.get_lines()Matplotlib.axes.axes.findobj()Matplotlib.axes.axes.draw()Matplotlib.axes.axes.draw_artist()Matplotlib.axes.axes.redraw_in_frame()Matplotlib.axes.axes.get_rasterization_zorder()Matplotlib.axes.axes.set_rasterization_zorder()Matplotlib.axes.axes.get_data_ratio()Matplotlib.axes.axes.get_default_bbox_extra_artists()Matplotlib.axes.axes.get_tightbbox()Matplotlib.axes.Axes.get_transformed_clip_path_and_affine()Matplotlib.axes.axes.get_window_extent()Matplotlib.axes.axes.get_xaxis_transform()Matplotlib.axes.axes.get_yaxis_transform()Matplotlib.axes.axes.has_data()Matplotlib.axes.axes.set()
Matplotlib 问答
Matplotlib和Seaborn的区别
matplotlib.axis
Matplotlib.axis.Axis.get_major_formatter()Matplotlib.axis.Axis.get_major_locator()Matplotlib.axis.Axis.get_minor_formatter()Matplotlib.axis.Axis.get_minor_locator()Matplotlib.axis.axis.remove_overlapping_locs()Matplotlib.axis.axis. set_label_cocord()Matplotlib.axis.axis.set_label_position()Matplotlib.axis.axis.set_major_formatter()Matplotlib.axis.axis.set_major_locator()Matplotlib.axis.axis.set_minor_formatter()Matplotlib.axis.axis.set_minor_locator()Matplotlib.axis.axis.get_label()Matplotlib.axis.axis.get_label_position()Matplotlib.axis.axis.get_label_text()Matplotlib.axis.axis.get_majorticklabels()Matplotlib.axis.get_majorticklines()Matplotlib.axis.axis.get_majorticklocs()Matplotlib.axis.axis.get_major_ticks()Matplotlib.axis.axis.get_minorticklabels()Matplotlib.axis.axis.get_minor_ticks()Matplotlib.axis.axis.set_label_text()Matplotlib.axis.axis.axis_date()Matplotlib.axis.axis.get_gridlines()Matplotlib.axis.axis.get_minorticklines()Matplotlib.axis.axis.get_minorticklocs()Matplotlib.axis.axis.get_offset_text()Matplotlib.axis.axis.get_ticklabels()Matplotlib.axis.axis.get_ticklines()Matplotlib.axis.axis.get_ticklocs()Matplotlib.axis.axis.grid()Matplotlib.axis.axis.set_tick_params()Matplotlib.axis.axis.get_data_interval()Matplotlib.axis.axis.get_minpos()Matplotlib.axis.axis.get_pickradius()Matplotlib.axis.axis.get_ticklabel_extents()Matplotlib.axis.axis.get_tick_space()Matplotlib.axis.axis.get_tightbbox()Matplotlib.axis.axis.get_view_interval()Matplotlib.axis.axis.set_data_interval()Matplotlib.axis.axis.set_pickradius()Matplotlib.axis.axis.set_view_interval()Matplotlib.axis.axis.get_units()Matplotlib.axis.axis.limit_range_for_scale()Matplotlib.axis.axis.reset_ticks()Matplotlib.axis.axis. set_default_interval()Matplotlib.axis.axis.set_ticklabels()Matplotlib.axis.axis.set_ticks()Matplotlib.axis.axis.set_units()Matplotlib.axis.axis.update_units()
Matplotlib.artist
Matplotlib.artist.artist.set_clip_path()Matplotlib.artist.artist.set_snap()Matplotlib.artist.artist.get_clip_box()Matplotlib.artist.artist.get_clip_on()Matplotlib.artist.artist.get_clip_path()Matplotlib.artist.artist.get_path_effects()Matplotlib.artist.artist.get_picker()Matplotlib.artist.artist.get_rasterized()Matplotlib.artist.artist.get_sketch_params()Matplotlib.artist.artist.get_snap()Matplotlib.artist.artist.properties()Matplotlib.artist.artist.set_clip_box()Matplotlib.artist.artist.get_visible()Matplotlib.artist.artist.get_zorder()Matplotlib.artist.artist.set()Matplotlib.artist.artist.set_clip_on()Matplotlib.artist.artist.set_path_effects()Matplotlib.artist.artist.set_picker()Matplotlib.artist.artist.set_rasterized()Matplotlib.artist.artist.set_sketch_params()Matplotlib.artist.artist.set_visible()Matplotlib.artist.artist.set_zorder()Matplotlib.artist.artist.add_callback()Matplotlib.artist.artist.draw()Matplotlib.artist.artist.format_cursor_data()Matplotlib.artist.artist.get_alpha()Matplotlib.artist.artist.get_animated()Matplotlib.artist.artist.get_contains()Matplotlib.artist.artist.get_url()Matplotlib.artist.artist.pickable()Matplotlib.artist.artist.update()Matplotlib.artist.artist.update_from()Matplotlib.artist.artist.axes()Matplotlib.artist.artist.findobj()Matplotlib.artist.artist.get_agg_filter()Matplotlib.artist.artist.remove_callback()Matplotlib.artist.artist.set_alpha()Matplotlib.artist.artist.set_animated()Matplotlib.artist.artist.set_contains()Matplotlib.axes.axes.add_callback()Matplotlib.axes.axes.remove_callback()使用Matplotlib在Python中绘制三曲面Matplotlib.artist.artist.get_children()Matplotlib.artist.artist.get_gid()Matplotlib.artist.artist.get_label()Matplotlib.artist.artist.get_transform()Matplotlib.artist.artist.get_transformed_clip_path_and_affine()Matplotlib.artist.artist.get_window_extent()Matplotlib.artist.artist.is_transform_set()Matplotlib.artist.artist.remove()Matplotlib.artist.artist.set_gid()Matplotlib.artist.artist.set_label()Matplotlib.artist.artist.set_transform()Matplotlib.artist.artist.set_url()
Matplotlib.patches
Matplotlib.patches.ArrowStyle类Matplotlib.patches.Circle()Matplotlib.patches.CirclePolygon类Matplotlib.patches.ConnectionPatch类Matplotlib.patches.PathPatchMatplotlib.patches.Rectangle()Matplotlib.patches.RegularPolygonMatplotlib.patches.Wedge类
Matplotlib 示例
在Python Matplotlib中使用色调色标和图例绘制3D散点图使用Python中的Matplotlib进行活跃产品销售分析在Matplotlib中使用scatter()绘制3D散点图添加图例在同一轴上添加Matplotlib盒图的图例使用Python的Matplotlib将一条线添加到散点图中在Matplotlib中调整图表边缘及X轴之间的间距在Matplotlib中制作旋转的3D图表在matplotlib中使用轮廓进行动画操作使用Matplotlib为图中的子图添加A、B、C注释Matplotlib中的自动图例创建使用黑色iPython Notebook主题来显示Seaborn/Matplotlib图表的最佳方法最佳方法在Matplotlib中绘制两条线之间的角度在Matplotlib中使用LaTeX加粗字体绘制轴标签带有Matplotlib的最小值、最大值、平均值和标准差的箱线图在Matplotlib中绘制具有不同长度数据的箱线图在Matplotlib中居中x轴刻度标签更改Matplotlib绘图的默认背景颜色在networkx(Matplotlib)中按权重着色边缘Matplotlib饼图中的条件标签删除在Matplotlib绘图中画等高线点状图案使用Python和Matplotlib控制3D散点图上的alpha值使用每月数据控制Matplotlib中条形图的宽度创建Pandas和Matplotlib.pyplot图例使用matplotlib创建3D动画从3D NumPy数组中创建Matplotlib中的3D图使用Matplotlib从字典创建在同一图上的多个箱线图使用Matplotlib定义图表上网格的大小在Matplotlib中区分正交投影和透视投影在Matplotlib中显示两个Sympy绘图(将第二个图添加到第一个图中)在Matplotlib中以实际大小显示不同的图像子图使用Matplotlib的pyplot.plot()绘制参数曲线在 Matplotlib 等高线图中绘制坐标轴线或原点。使用networkX和Matplotlib绘制网络图使用Matplotlib和NumPy在图像上绘制圆形Matplotlib实现动态更新柱状图解释一下Python中Matplotlib绘图的解剖结构?使用Matplotlib Python解释如何构建箭头图?在Matplotlib中填充对数坐标下曲线下的区域使用Matplotlib在 Python 中填充曲线和 X 轴之间的区域清空matplotlib中的所有当前图形用 Python Matplotlib 对含 NaN 的图像进行高斯滤波在 Matplotlib 中绘制 k-NN 决策边界使用Matplotlib绘制离散值的直方图Matplotlib中的水平堆叠条形图如何在Matplotlib中为我的柱形图和扇形图添加纹理?如何将pyplot函数附加到图形实例上?(Matplotlib)如何在Matplotlib中将数字转换为颜色比例?如何在Matplotlib中的条形图中显示列上的文本?如何在数据文件发生更改时动态更新Matplotlib图表?如何在Matplotlib的饼图上生成更多颜色?如何在控制台应用程序上显示Pyplot图像? (Matplotlib)如何在Matplotlib中获取轴上单个单位的长度?如何获取通过等高线图(Matplotlib)绘制的一条直线的(x,y)值?如何使Matplotlib.pyplot停止强制我的标记风格?如何使用Matplotlib制作绘图的xtick标签为简单图形?如何在Matplotlib中添加一张表?如何在Matplotlib Python中绘制单个数据点?如何在Matplotlib中绘制磁滞阈值?如何在 Python Matplotlib 中绘制两个不同间隔的时间序列在同一张图中?如何在Matplotlib中以编程方式选择特定的子图?如何使用Matplotlib在Python中渲染三维直方图?如何在Python中设置matplotlib的后端?如何写针对使用Matplotlib的代码的单元测试?如何使用Python中的Matplotlib创建3维等高线图?如何在Python中使用Matplotlib创建三维散点图?如何使用Python中的Matplotlib创建三维线图?如何使用matplotlib和Python在同一图中绘制多个图?如何使用Matplotlib修改networkx中节点的轮廓颜色?如何使用“subplot”功能在Matplotlib Python中创建两个图形?如何在使用 LaTeX 渲染时更改 Matplotlib 绘图中的坐标轴刻度字体?如何改变Matplotlib绘图中刻度字体大小?如何改变matplotlib.pyplot.colorbar.ColorbarBase的刻度字体大小?如何在Matplotlib中转换(或缩放)轴值并重新定义刻度频率?如何在Matplotlib中找到两条线段的交点?如何在Python/Jupyter笔记本中省略Matplotlib的输出?如何绘制与pylab的specgram()函数相同的频谱图?(Matplotlib)如何使用Python的Matplotlib重绘图像?如何在 Matplotlib 中将矩形设置为特定颜色?在单个IPython笔记本中如何显示同一Matplotlib图形多次?如何更改Matplotlib中所有文本的默认字体颜色?如何在Matplotlib中创建两个点之间的线段?如何在Python的Matplotlib中获取当前图形序号?如何提高Matplotlib图像质量?如何在Matplotlib中仅显示图例中的文本标签?imshow如何处理M x N x 4输入中的alpha通道?(Matplotlib)如何在交互式图中获取指向鼠标的 (x,y) 坐标(Python Matplotlib)?如何将matplotlib对象通过函数传递; 作为Axis,Axes或Figure?如何在 Matplotlib 中访问坐标轴标签对象?如何为Matplotlib中的hist2d绘图添加颜色条?如何在Matplotlib中添加光标到曲线上?如何使用Matplotlib在Seaborn facetgrid bar图上添加图例?如何向Matplotlib饼图添加图例?如何在Matplotlib中添加第二个X轴在第一个X轴的底部?如何在使用Pandas' plot创建的图中添加共享的x标签和y标签? (Matplotlib)如何在Matplotlib中添加粗体的注释文字?如何使用Matplotlib在X轴下添加脚注?如何在Matplotlib的imshow()中添加图例?如何为由Pandas生成的分组直方图(Matplotlib)添加图例和标题?如何在Matplotlib中的绘图中添加文本?如何在Python Matplotlib中添加第三个级别的刻度?如何在Matplotlib中调整树状图的分支长度?如何调整Matplotlib图例框的大小?如何为Matplotlib/Seaborn子图设置多图布局的间距?如何调整Matplotlib中字符串Y轴的“刻度频率”?如何在Matplotlib中将轴标签对齐到右侧或顶部?如何将 Matplotlib 图例的行与 2 列对齐?如何在Matplotlib的双Y轴图表中对齐柱状图和线条?如何在Matplotlib中制作3D plot_surface动画?如何为Seaborn热力图或相关性矩阵(Matplotlib)制作动画?如何在Matplotlib中制作正弦曲线动画?如何对按时间顺序排列的Matplotlib图表进行动画处理?如何在Matplotlib中实现文本动画?如何在Matplotlib中注释X轴的一段范围?如何在Matplotlib中使用一个文本标注多个点?如何使用matplotlib在X轴上添加单个标记的刻度?如何在Matplotlib imshow中对矩阵应用掩码?如何适当绘制来自MLPClassifier的(loss_curve_)的损失值?(Matplotlib)如何在matplotlib Python中自动调整文本大小?如何在Matplotlib中更好地栅格化图表而不模糊标签?如何在matplotlib中构建没有附加绘图的颜色条?如何使用matplotlib.pyplot更改表格的字体大小?如何在Matplotlib中更改坐标轴背景颜色?如何在Matplotlib中将条形图的值改为百分比?如何在Matplotlib(Python)中更改字体?如何在条件成立时改变单个条的颜色(Matplotlib)?如何更改Matplotlib图表的时间刻度标签频率?如何在Matplotlib中更改Pandas数据框绘图的DPI?如何使用Matplotlib更改绘图的面颜色?如何在 Jupyter 笔记本中使用 Matplotlib 更改 matshow() 的 figsize?如何改变Matplotlib中科学计数法的字体大小?如何在matplotlib中更改imshow的比例而不拉伸图像?如何在Matplotlib中改变刻度标签和轴标签之间的间隔?如何在Pandas绘制多个条形图时改变条形之间的间距?(Matplotlib)如何调整Matplotlib表格的透明度?如何检查Matplotlib的pylab后端是否以行内方式运行?如何使用Matplotlib通过键盘输入关闭Python图形?如何使用连续的值着色Matplotlib散点图?如何在Matplotlib中基于DataFrame列名给Seaborn boxplot上色?如何将几个matplotlib axes subplot组合成一个图形?如何将数据值转换为Matplotlib的颜色信息?如何将 Matplotlib 图形转换为 PIL 图像对象?如何使用Matplotlib创建100%堆积面积图?如何在Matplotlib中创建一个分散堆叠条形图?如何在Matplotlib中为3D条形图创建图例?如何使用Matplotlib创建线型图?如何创建带有阈值线的Matplotlib柱状图?如何使用Matplotlib从灰度图创建曲面图?如何用Matplotlib创建Swarm图?如何在Python Matplotlib中创建华夫格图(Waffle Chart)?如何自定义Matplotlib中的X轴刻度?如何在matplotlib图表上循环使用不同的颜色和线条风格?如何在Matplotlib中减少色条的宽度?如何降低Matplotlib中子图刻度标签的密度?如何降低Matplotlib中的阴影密度?如何在Matplotlib中显示所有标签值?如何在Matplotlib中在条形图上方显示百分比?如何在Matplotlib Python中显示饼图?如何在Python中使用matplotlib显示堆叠条形图?如何在Matplotlib中绘制轴外的线?如何在Matplotlib中绘制更多类型的线条?如何在NetworkX/Matplotlib中绘制节点颜色图?如何在matplotlib中从一组点中绘制最大的多边形?如何在Matplotlib的 Seaborn boxplot 中编辑whiskers,fliers,caps等属性?如何使用matplotlib进行Y轴的指数缩放?如何基于Matplotlib中的Pandas数据帧将图表导出为PDF?如何从Matplotlib图中提取数据?如何使用Python Matplotlib填充彩虹色拱线下方?如何找到matplotlib的样式名称?如何强制Matplotlib将X轴上的值显示为整数?如何在Matplotlib中获取一个反向累积直方图?如何从Matplotlib中的绘图获取所有图例?如何在Matplotlib中获取虚线的交替颜色?如何在Matplotlib的同一注释中使用不同字体大小?如何在Matplotlib中获得具有独立缩放的多个重叠图?如何在使用pcolormesh(Matplotlib)时获得平滑的插值?如何获取matplotlib.pyplot.scatter默认的蓝色颜色?如何在Matplotlib中获得字体族(或字体名称)列表?如何在mplot3d(matplotlib + python)中获取选定对象的属性?如何在Matplotlib中给sns.clustermap提供预计算的距离矩阵?如何在Matplotlib中处理带时区的时间?如何在Matplotlib中隐藏坐标轴但保留坐标轴标签的3D绘图?如何在Python中导入Matplotlib?如何在Matplotlib的streamplot中提高色图/线宽质量?如何在Matplotlib柱状图中增加误差线的粗度?如何在Matplotlib中插入比例尺来表示地图尺寸?在virtualenv下如何在Mac 10.7安装Matplotlib?如何在Windows上使用Conda安装Matplotlib而不安装Qt?如何标记和更改 Seaborn kdeplot 坐标轴的刻度?(Matplotlib)如何在Matplotlib中制作一张有折断的水平条形图?如何在matplotlib中绘制分组箱线图?如何在Seaborn FacetGrid中使用Matplotlib制作热力图?如何在Matplotlib中创建马赛克图?如何使用Matplotlib在极坐标下制作箭头图?如何在Matplotlib中制作一个循环的箭头?如何使用Matplotlib在Python中使色标方向为水平方向?如何使用Python的Matplotlib制作空心方形标记?如何在Matplotlib中制作更长的子图刻度线?如何在Matplotlib中使线上的标记变小?如何将 Matplotlib 散点图作为一组透明显示?如何让Matplotlib显示所有X坐标?如何使用Matplotlib创建超过10个子图的图形?如何使用networkx和Matplotlib制作多部分图?如何在Matplotlib中制作semilogx和semilogy图?如何在Python中使用matplotlib在单个页面上制作多个图形?如何在Matplotlib中轴上制作简单的双头箭头?如何在Matplotlib中制作Parula色图?如何在Matplotlib中制作具有相同bin宽度的两个直方图?如何使用Matplotlib使两个标记共享图例中的相同标签?如何使xticks均匀分布,尽管它们的值不同?(Matplotlib)如何在Python Matplotlib脚本运行时操作图形?如何在Matplotlib上标记等高线的特定水平?如何将两个现有的Matplotlib图合并到一个图中?如何在Matplotlib-venn中修改字体大小?如何在Matplotlib中将标签从底部移到顶部而不添加“刻度”?如何在Matplotlib中将Seaborn散点图的图例移动到外部?如何在Matplotlib中的同一图中命名不同的线?如何将RGB颜色值传递给Python的Matplotlib eventplot?如何使用Matplotlib在绘图中放置自定义图例符号?如何在Python Matplotlib中将X轴网格放置在频谱图上?如何使用Python Matplotlib绘制3D图形?如何在Python Matplotlib中绘制自定义颜色和大小的4D散点图?如何在Python中使用colorbar Matplotlib绘制一个2D矩阵?如何在Matplotlib中绘制3D连续线?如何使用Matplotlib在 Python 中绘制 3D 密度图?如何在Matplotlib中绘制具有多个标签的条形图?如何从Pandas系列中用Matplotlib绘制条形图?如何在Python Matplotlib中绘制密度图?如何在Python中使用def来绘制函数?(Matplotlib)在Seaborn中如何使用'hue'参数绘制联合图?(Matplotlib)如何在Pandas中使用Matplotlib绘制日期的核密度图?如何在Matplotlib中从直方图数据绘制折线图?如何在Matplotlib中绘制带有每个数据点间隔的线?如何使用matplotlib绘制具有最小平滑度的线(折线图)?如何使用Matplotlib绘制多彩的线,比如彩虹?如何在Matplotlib中绘制嵌套饼图?如何绘制非正方形的 Seaborn jointplot 或 JointGrid?(Matplotlib)如何使用Matplotlib绘制Pandas DataFrame?如何使用所有 xticks(Matplotlib)绘制 Pandas 多级索引 DataFrame?如何在Matplotlib中的不同子图中绘制一个pcolor彩条图?如何在Python中使用Matplotlib绘制相位谱?如何使用matplotlib中的数学方程绘制一个平面?如何在Matplotlib中绘制彩虹圆?如何在Matplotlib中绘制圆形中的矩形?如何在Matplotlib上的时间轴上绘制矩形?如何使用 Matplotlib 绘制 http URL 上的远程图像?如何在 Matplotlib 中绘制一个连续变色的单条线?如何在Matplotlib中将 Pandas dataframe 中的时间作为索引进行绘图?如何在Python中绘制带有置信区间的时间序列数组?(Matplotlib)如何使用输入的*.txt文件绘制一个简单的条形图(Python,Matplotlib)?如何在Matplotlib中绘制水印图像?如何在Python中使用Matplotlib画出一个角度谱?如何在matplotlib中绘制动画矩阵?如何在Matplotlib Python中绘制Pandas dataframe中的区域?如何在Python中使用Matplotlib绘制数组?如何使用Matplotlib的imshow()函数绘制具有非线性Y轴的图像?如何在Python的Matplotlib中绘制累积分布函数(cdf)?如何使用Matplotlib绘制collections.Counter直方图?如何使用 Matplotlib 绘制复数(Argand 图)?如何在Matplotlib中绘制contourf和log颜色刻度?如何使用Matplotlib和Pandas在Python中绘制CSV数据?如何使用Matplotlib在X轴上绘制特定日期的数据?如何使用Matplotlib在时间上绘制事件?如何在Python中使用Matplotlib绘制alpha和beta参数的gamma分布图?如何在Matplotlib中绘制半个或四分之一极坐标图?如何在Matplotlib中绘制六角形直方图?如何使用Matplotlib从Pandas中的数据框中绘制直方图?如何使用Python在Matplotlib中绘制纵向幅度谱?如何在Python的Matplotlib中绘制幅度谱?如何在Matplotlib中绘制掩码和NaN值?如何在Matplotlib中绘制重叠线?如何使用Python Matplotlib绘制带有单个饼图的突出显示?如何在Python的Matplotlib中绘制信号图形?如何使用Matplotlib在极坐标轴上绘制正弦曲线?如何在Matplotlib中绘制真/假或开/关数据?如何在Matplotlib中绘制两个Pandas时间序列的相同图,并在该图中添加图例和次级Y轴?如何在Matplotlib中并列绘制两个Seaborn lmplots?如何在Matplotlib中使用不同的比例绘图?如何使用xgboost.XGBCClassifier.feature_importances_模型画图?(Matplotlib)如何定位和对齐Matplotlib图例?如何正确启用matplotlib.animation的ffmpeg?如何在Python/Matplotlib中将文本放在等宽图形的角落?如何在Python Matplotlib中将原点放在余弦曲线的中心?如何在Matplotlib中将标题放在图形底部?如何将matplotlib中的xtick标签放置在框内?如何重新定义Matplotlib colormap中特定值的颜色?如何在Matplotlib中刷新文本?如何在matplotlib图中去除LaTeX风格数学公式中的多余空格?如何从Matplotlib对数-对数图中移除科学计数法?如何在Matplotlib中删除子图之间的空白?如何在Seaborn/Matplotlib中消除factorplot Y轴的科学计数法?如何在Matplotlib中从图中检索colorbar实例?如何检索Matplotlib savefig()函数支持的文件格式列表?如何从Pandas绘图函数返回matplotlib.figure.Figure对象?如何旋转简单的matplotlib Axes?如何旋转Matplotlib注释以匹配一条线?如何在 Matplotlib 中旋转 subplot 中的刻度标签?如何使用Matplotlib/Numpy将数组保存为灰度图像?如何使用matplotlib.pyplot保存图像?如何将Matplotlib中的图形保存为PDF格式的光栅图像?如何保存Matplotlib 3D旋转图?