虹膜数据集的探索性数据分析
简介
在机器学习和数据科学中,探索性数据分析是检查一个数据集并总结其主要特征的过程。它可能包括可视化方法,以更好地表现这些特征或对数据集有一个总体的了解。它是数据科学生命周期中非常重要的一步,往往要消耗一定的时间。
在这篇文章中,我们将通过探索性数据分析看到鸢尾花数据集的一些特点。
虹膜数据集
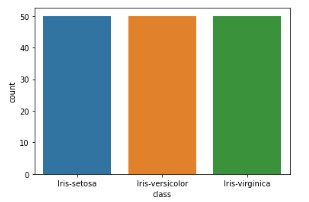
鸢尾花数据集非常简单,通常被称为 “你好世界”。该数据集有三个不同种类的花的4个特征,即Iris setosa, Iris virginica, and Iris versicolor。这些特征是萼片长度、萼片宽度、花瓣长度和花瓣宽度。数据集中有150个数据点,每个物种有50个数据点。
虹膜数据集的EDA
首先,让我们用pandas从CSV文件 “iris_csv.csv “中加载数据集,并对它有一个大致的了解。
该数据集可从以下链接下载。
https://datahub.io/machine-learning/iris/r/iris.csv
代码实现
示例 1
import pandas as pd
import numpy as np
import seaborn as sns
import matplotlib.pyplot as plt
%matplotlib inline

df = pd.read_csv("/content/iris_csv.csv")
df.head()
| sepallength | sepalwidth | petallength | petalwidth | class | |
|---|---|---|---|---|---|
| 0 | 5.1 | 3.5 | 1.4 | 0.2 | Iris-setosa |
| 1 | 4.9 | 3.0 | 1.4 | 0.2 | Iris-setosa |
| 3 | 4.6 | 3.1 | 1.5 | 0.2 | Iris-setosa |
| 4 | 5.0 | 3.6 | 1.4 | 0.2 | Iris-seto |
示例 2
df.info()

RangeIndex: 150 entries, 0 to 149
Data columns (total 5 columns):
 #   Column       Non-Null Count  Dtype
---  ------       --------------  -----
 0   sepallength  150 non-null    float64
 1   sepalwidth   150 non-null    float64
 2   petallength  150 non-null    float64
 3   petalwidth   150 non-null    float64
 4   class        150 non-null    object
dtypes: float64(4), object(1)
memory usage: 6.0+ KB
df.shape

(150, 5)


## Statistics about dataset
df.describe()
| sepallength | sepalwidth | petallength | petalwidth | |
|---|---|---|---|---|
| count | 150.000000 | 150.000000 | 150.000000 | 150.000000 |
| mean | 5.843333 | 3.054000 | 3.758667 | 1.198667 |
| std | 0.828066 | 0.433594 | 1.764420 | 0.763161 |
| min | 4.300000 | 2.000000 | 1.000000 | 0.100000 |
| 25% | 5.100000 | 2.800000 | 1.600000 | 0.300000 |
| 50% | 5.800000 | 3.000000 | 4.350000 | 1.300000 |
| max | 7.900000 | 4.400000 | 6.900000 | 2.500000 |
示例 3
## checking for null values

df.isnull().sum()

sepallength    0
sepalwidth     0
petallength    0
petalwidth     0
class          0
dtype: int64

## Univariate analysis
df.groupby('class').agg(['mean', 'median'])  # passing a list of recognized strings
df.groupby('class').agg([np.mean, np.median])
| sepallength | sepalwidth | petallength | petalwidth | |||||
|---|---|---|---|---|---|---|---|---|
| mean | median | mean | median | mean | median | mean | median | |
| class | ||||||||
| Iris−setosa | 5.006 | 5.0 | 3.418 | 3.4 | 1.464 | 1.50 | 0.244 | 0.2 |
| Iris−versicolor | 5.936 | 5.9 | 2.770 | 2.8 | 4.260 | 4.35 | 1.326 | 1.3 |
| Iris−virginica | 6.588 | 6.5 | 2.974 | 3.0 | 5.552 | 5.55 | 2.026 | 2.0 |
示例 4
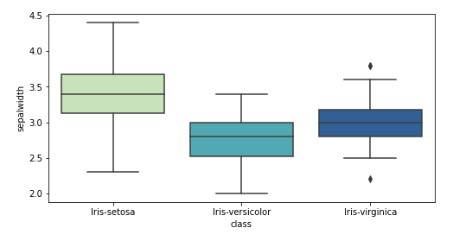
## Box plot
plt.figure(figsize=(8,4))
sns.boxplot(x='class',y='sepalwidth',data=df ,palette='YlGnBu')
示例 5
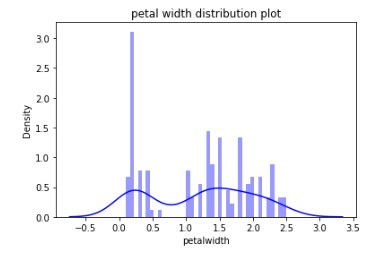
## Distribution of particular species
sns.distplot(a=df['petalwidth'], bins=40, color='b')
plt.title('petal width distribution plot')
示例 6
## count of number of observation of each species

sns.countplot(x='class',data=df)
示例 7
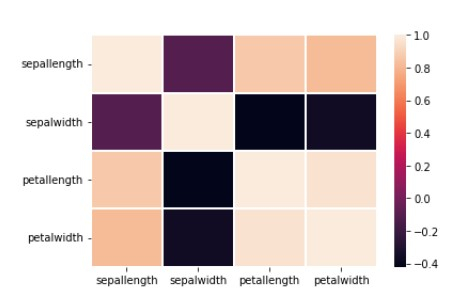
## Correlation map using a heatmap matrix

sns.heatmap(df.corr(), linecolor='white', linewidths=1)
示例 8
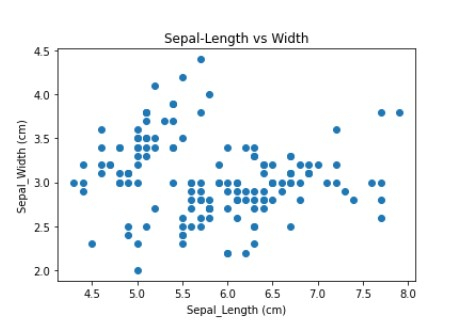
## Multivariate analysis – analyis between two or more variable or features
## Scatter plot to see the relation between two or more features like sepal length, petal length,etc
axis = plt.axes()

axis.scatter(df.sepallength, df.sepalwidth)

axis.set(xlabel='Sepal_Length (cm)',
   ylabel='Sepal_Width (cm)',
   title='Sepal-Length vs Width');
示例 9
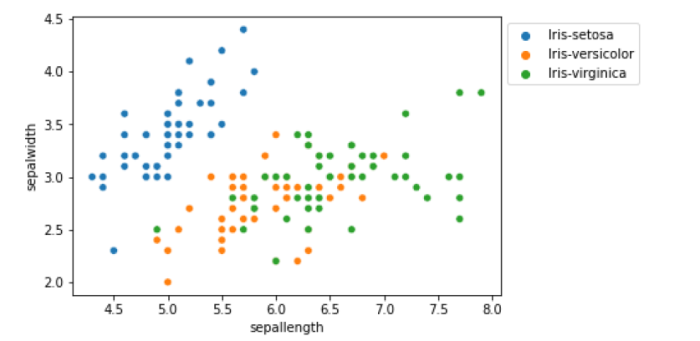
sns.scatterplot(x='sepallength', y='sepalwidth', hue='class', data=df,
plt.show()
示例 10
## From the above graph we can see that
# Iris-virginica has a longer sepal length while Iris-setosa has larger sepal width
# For setosa sepal width is more than sepal length
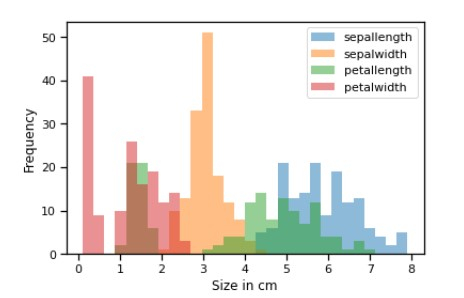
## Below is the Frequency histogram plot of all features
axis = df.plot.hist(bins=30, alpha=0.5)
axis.set_xlabel('Size in cm');
示例 11
# From the above graph we can see that sepalwidth is longer than any other feature followed by petalwidth
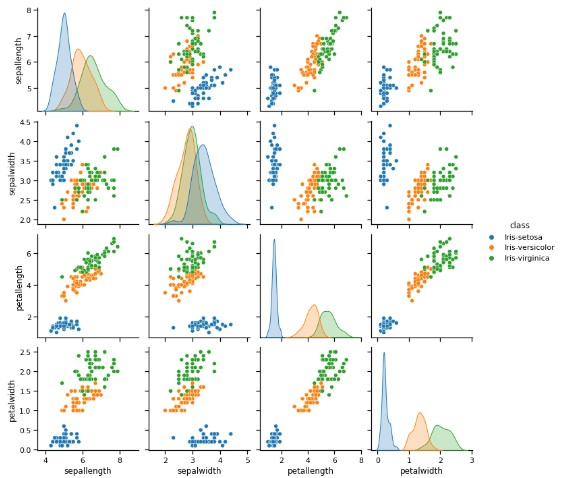
## examining correlation
sns.pairplot(df, hue='class')
示例 12
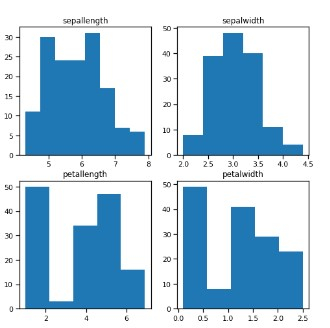
figure, ax = plt.subplots(2, 2, figsize=(8,8))

ax[0,0].set_title("sepallength")
ax[0,0].hist(df['sepallength'], bins=8)

ax[0,1].set_title("sepalwidth")
ax[0,1].hist(df['sepalwidth'], bins=6);

ax[1,0].set_title("petallength")
ax[1,0].hist(df['petallength'], bins=5);

ax[1,1].set_title("petalwidth")
ax[1,1].hist(df['petalwidth'], bins=5);
示例 13
# From the above plot we can see that –
# - Sepal length highest freq lies between 5.5 cm to 6 cm which is 30-35 cm
# - Petal length highest freq lies between 1 cm to 2 cm which is 50 cm
# - Sepal width highest freq lies between 3 cm to 3.5 cm which is 70 cm
# - Petal width highest freq lies between 0 cm to 0.5 cm which is 40-45 cm
结论
探索性数据分析是数据科学家和分析师都极为常用的。它能告诉我们很多关于给定数据的特征、其分布以及它如何有用的信息。
 极客教程
极客教程