R语言 放大ggplot2绘图而不删除数据
在这篇文章中,我们将讨论如何使用R编程语言中的ggplot2包在不移除数据的情况下放大到ggplot2图中。在不删除数据的情况下放大到ggplot2图的方法如下。
- 使用ylim()/xlim()函数放大到ggplot2图而不删除数据
- 使用coord_cartesian()函数放大到ggplot2图而不删除数据
方法1:使用ylim()/xlim()函数
ylim()/xlim()函数: 设置y轴/x轴界限的便利函数。
语法
ylim(...)
xlim(...)
参数
- ...: 如果是数字,将创建一个连续的刻度,如果是因子或字符,将创建一个离散的刻度。
例子
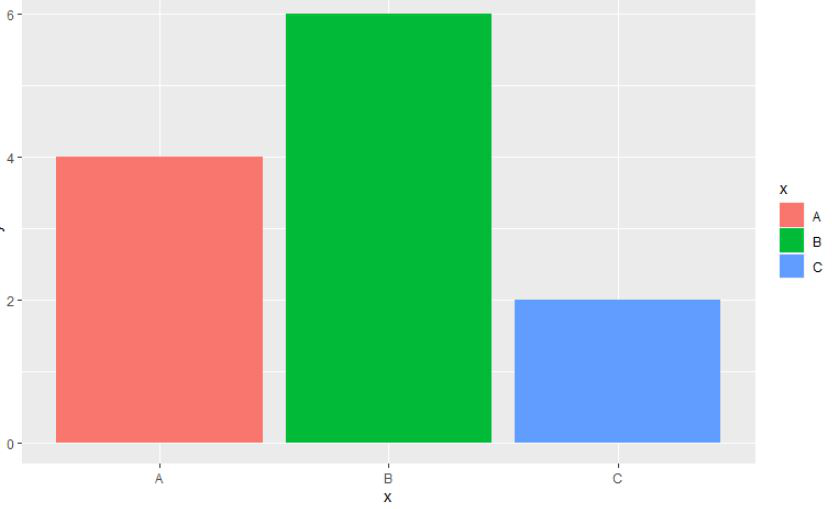
在这个例子中,我们将使用xlim()函数来获得给定数据的ggplot2条形图的放大视图,而无需在R编程语言中删除任何初始数据。
# load the packages
library("ggplot2")

# create the dataframe with letters and numbers
gfg < -data.frame(
    x=c('A', 'B', 'C', 'D', 'E', 'F'),
    y=c(4, 6, 2, 9, 7, 3))

# plot the given data
# with A,B and C as titles to the bars
plot < -ggplot(gfg, aes(x, y, fill=x)) +
geom_bar(stat="identity")
plot+xlim('A', 'B', 'C')
输出
方法2:使用coord_cartesian()函数
笛卡尔坐标系是最熟悉的,也是最常见的坐标系类型。在坐标系上设置限制将放大绘图(就像你用放大镜看一样),而不会像在比例尺上设置限制那样改变基础数据。
语法
coord_cartesian( xlim = NULL, ylim = NULL,expand = TRUE, default = FALSE, clip = “on”)
参数
- xlim, ylim: x轴和y轴的极限值。
- expand: 如果是TRUE,即默认值,会在极限值上增加一个小的扩展因子,以确保数据和坐标轴不会重叠。
- default: 这是默认的坐标系吗?
- clip: 绘图是否应被剪切到绘图面板的范围内?
例子
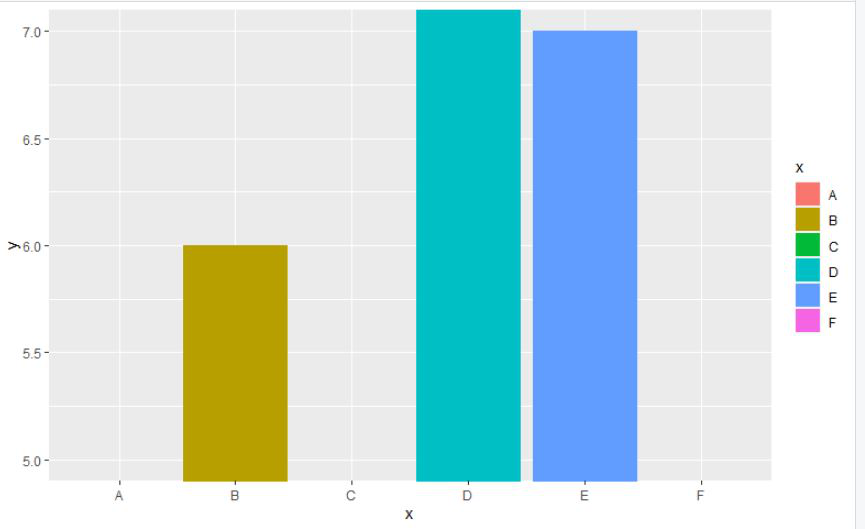
在这个,例子中,我们将使用coord_cartesian()函数与ylim()函数来获得给定数据的ggplot2条形图的放大视图,而不需要删除R编程语言中的任何初始数据。
# load the package
library("ggplot2")

# create the dataframe with letters
# and numbers
gfg < -data.frame(
    x=c('A', 'B', 'C', 'D', 'E', 'F'),
    y=c(4, 6, 2, 9, 7, 3))

# plot the catrtesian bar
plot < -ggplot(gfg, aes(x, y, fill=x)) +
geom_bar(stat="identity")
plot+coord_cartesian(ylim=c(5, 7))
输出
 极客教程
极客教程
