R语言 使用ggplot2和treemapify绘制树状图
在这篇文章中,我们将学习R编程语言中的Treemap与ggplot2和treemapify。
简介
一般来说,TreeMaps是用来可视化分层数据的。顾名思义,树状图被划分为矩形框,其中第一个矩形框是图中所有框的根,在树状图中,从最有价值的数据到最小价值的数据的层次被绘制出来。在R语言编程中,这些地图可以使用ggplot2和treemapify包中的函数来实现。
R语言 绘制树状图的方法
使用geom_treemap绘制基本树状图
第1步: 首先我们需要安装并加载所有需要的软件包
# Installing required packages
install.packages("ggplot2")
install.packages("treemapify")

# Importing required library
library(ggplot2)
library(treemapify)
第2步: 接下来让我们创建一个水果销售的样本数据框。
# Creating Dataframe
df<- data.frame(Fruits=c("Banana","Apple","Melon",
 "Plums","Pineapple","Orange","Apricot","Grapes"),
                sales=c(25000,22000,15000,5000,
                        18000,20000,3000,9000))
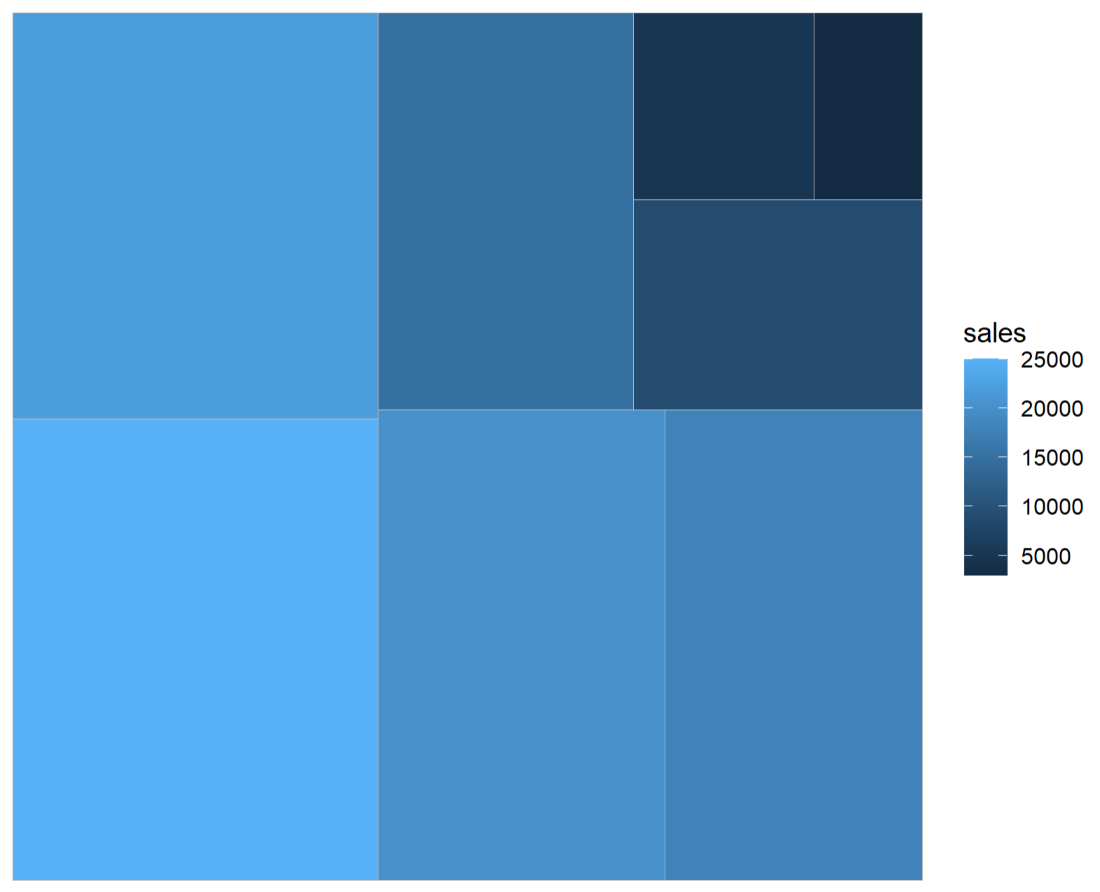
第3步: 现在让我们在ggplot()和geom_treemap()函数的帮助下绘制Simple TreeMap。
# Importing required library
library(ggplot2)
library(treemapify)

# Creating dataframe
df<- data.frame(Fruits=c("Banana","Apple","Melon",
 "Plums","Pineapple","Orange","Apricot","Grapes"),
                sales=c(25000,22000,15000,5000,
                        18000,20000,3000,9000))
# Plotting the TreeMap
ggplot2::ggplot(df,aes(area=sales,fill=sales))+
  treemapify::geom_treemap()
输出

给瓷砖添加标签
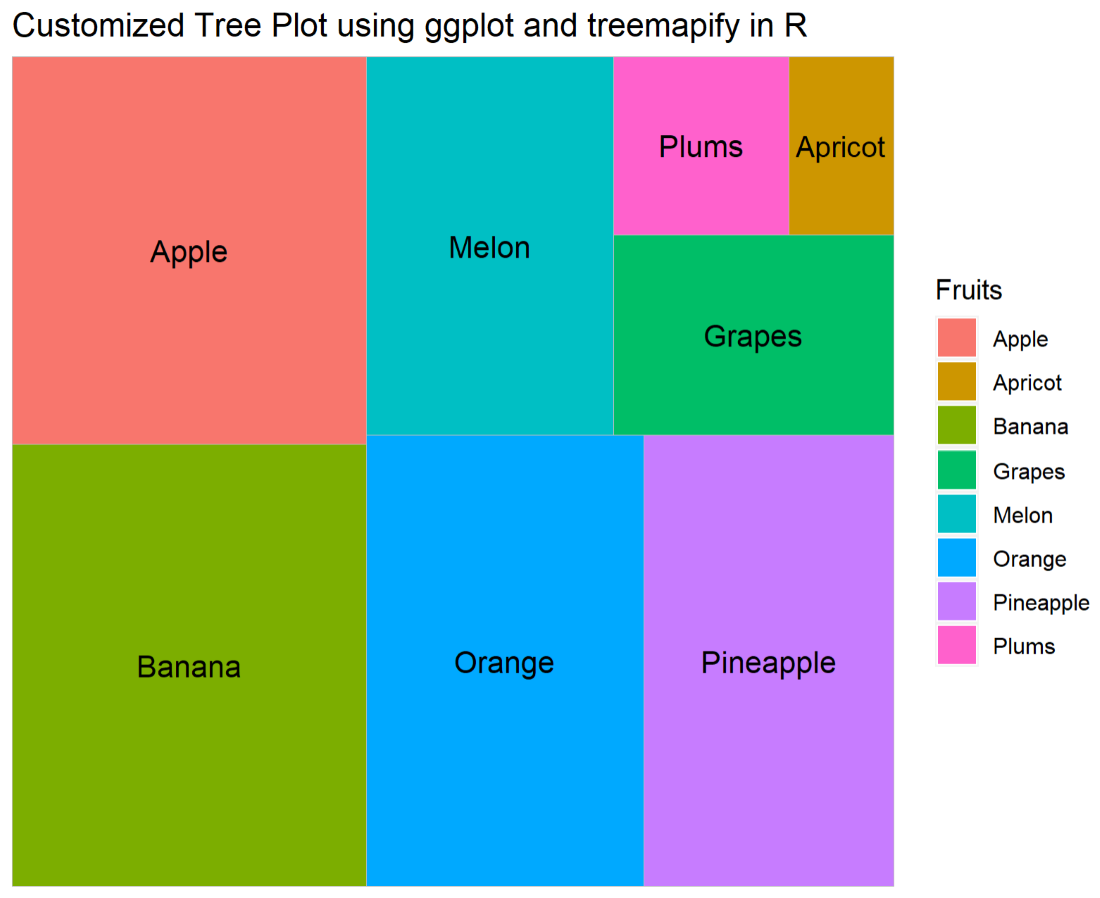
为了使绘图更具互动性,让我们通过在每个矩形框中添加文本标签和在绘图中添加标题来定制上述TreeMap。
# Importing required library
library(ggplot2)
library(treemapify)

# Creating Dataframe
df<- data.frame(Fruits=c("Banana","Apple","Melon",
   "Plums","Pineapple","Orange","Apricot","Grapes"),
                sales=c(25000,22000,15000,5000,
                        18000,20000,3000,9000))

# Plotting TreeMap Graph
ggplot2::ggplot(df,aes(area=sales,fill=Fruits,label=Fruits))+
  treemapify::geom_treemap(layout="squarified")+
  geom_treemap_text(place = "centre",size = 12)+
  labs(title="Customized Tree Plot using ggplot and treemapify in R")
输出

子组树状图
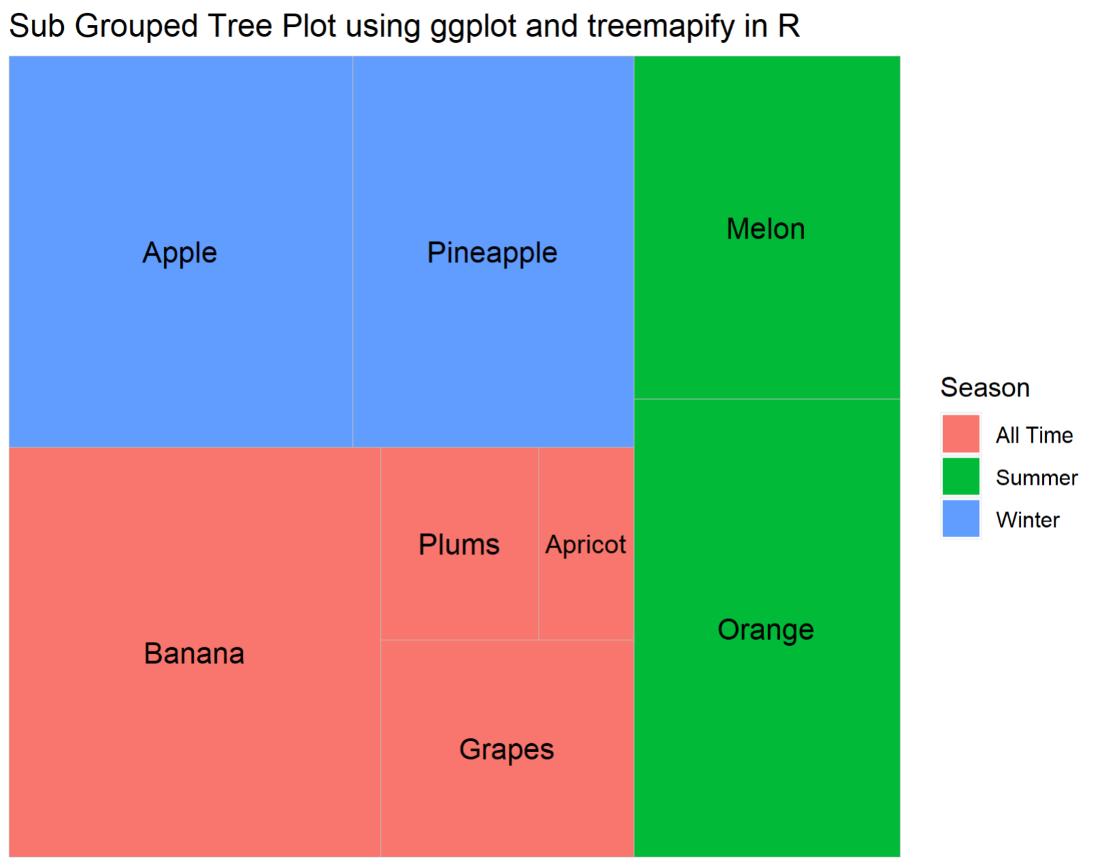
在我们的例子中,子组树图是根据水果在不同季节的可用性来划分的,可以通过在ggplot()函数中初始化绘图的美学(ais)中的子组属性来绘制,如下所示。
# Importing required library
library(ggplot2)
library(treemapify)

# Creating dataframe
df<- data.frame(Fruits=c("Banana","Apple","Melon",
     "Plums","Pineapple","Orange","Apricot","Grapes"),
                Season=c("All Time","Winter","Summer",
    "All Time","Winter","Summer","All Time","All Time"),
                sales=c(25000,22000,15000,5000,
                        18000,20000,3000,9000))

# Plotting TreeMap Graph
ggplot2::ggplot(df,aes(area=sales,fill=Season,
                       label=Fruits,subgroup=Season))+
  treemapify::geom_treemap(layout="squarified")+
  geom_treemap_text(place = "centre",size = 12)+
  labs(title="Sub Grouped Tree Plot using ggplot and treemapify in R")
输出

 极客教程
极客教程