R语言 Lattice包绘制条形图
一般来说,条形图是用来绘制单变量数据的。它是一个二维图,在X轴上绘制响应变量。
这些是直方图或密度图的替代品。它通常用于绘制小的数据集,所以这里我们将使用虹膜数据集来实现它。
在R编程中,条形图可以用 lattice 包中的 stripplot() 函数来实现。
语法: stripplot(formula,data,jitter,factor,xlab,ylab,main)
其中。
- data – 需要考虑绘制的数据框
- jitter – 用于指定数值是否应该被抖动
- factor – 用来指定抖动的数量
- xlab – 用于指定X轴的标签
- main – 用来指定绘图的标题
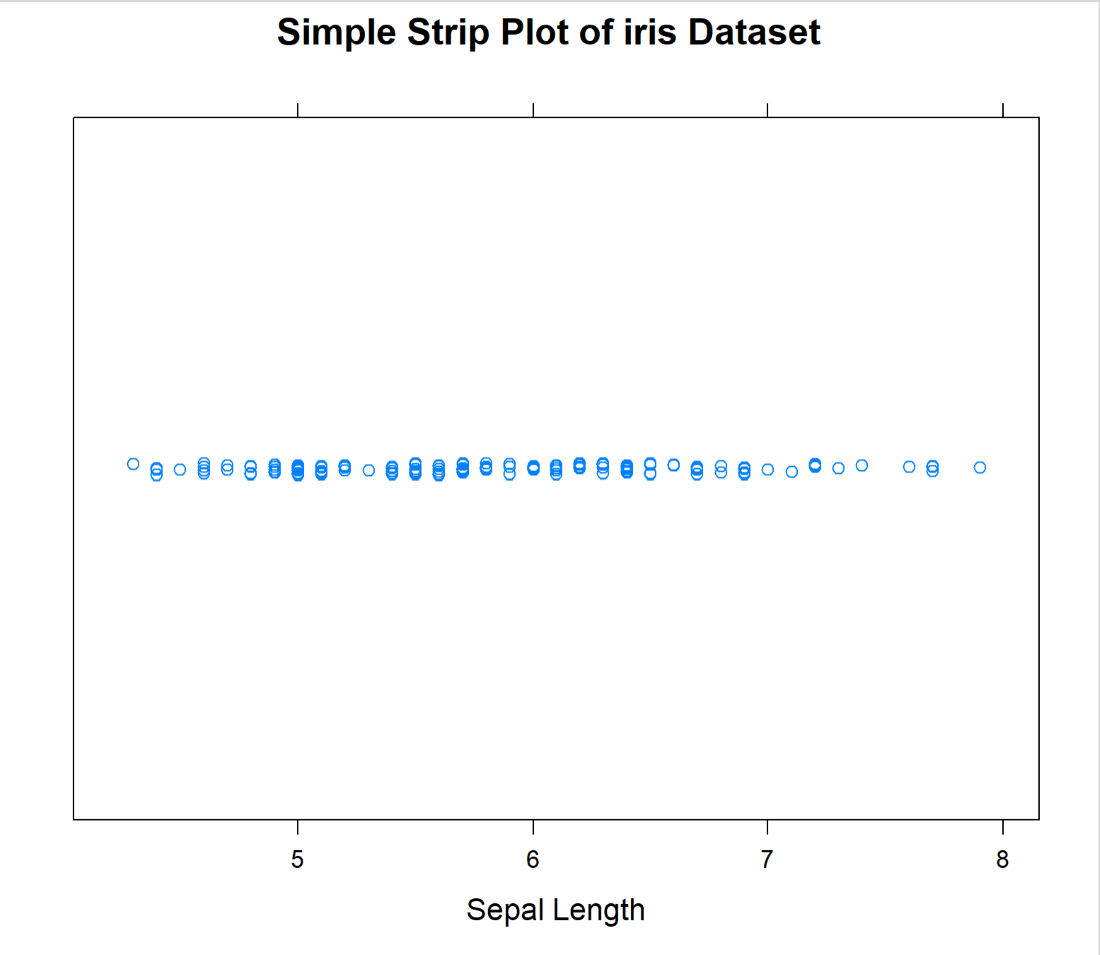
让我们看看简单带状图的代码。在这里,我们将使用虹膜数据集,并使用 stripplot() 绘制萼片长度。
# Install the required package
install.packages("lattice")
# Load the installed package
library(lattice)

# Load the default dataset(iris) into current working environment
data(iris)

# Plotting the Simple Strip plot using striplot()
lattice::stripplot(~Sepal.Length, data=iris,
                   jitter=TRUE, xlab="Sepal Length",
                   main="Simple Strip Plot of iris Dataset")
输出

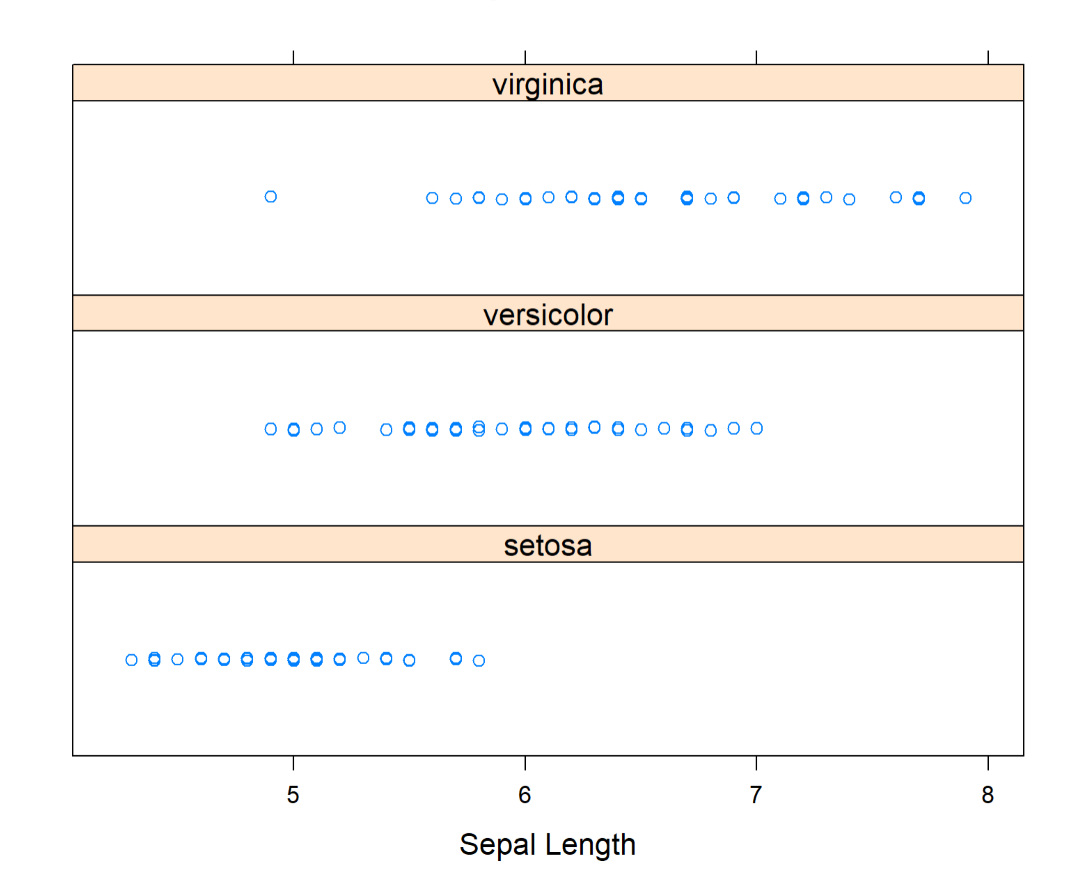
我们还可以为每个类别绘制分区条形图。在这里,我们是根据物种栏进行分类的。代码如下。
# Install the required package
install.packages("lattice")
# Load the installed package
library(lattice)

# Load the default dataset(iris) into current working environment
data(iris)

# Plotting the Partitioned Strip plot using striplot()
lattice::stripplot(~Sepal.Length|Species, data=iris,
                   jitter=TRUE, layout=c(1,3),
                   xlab="Sepal Length")
输出

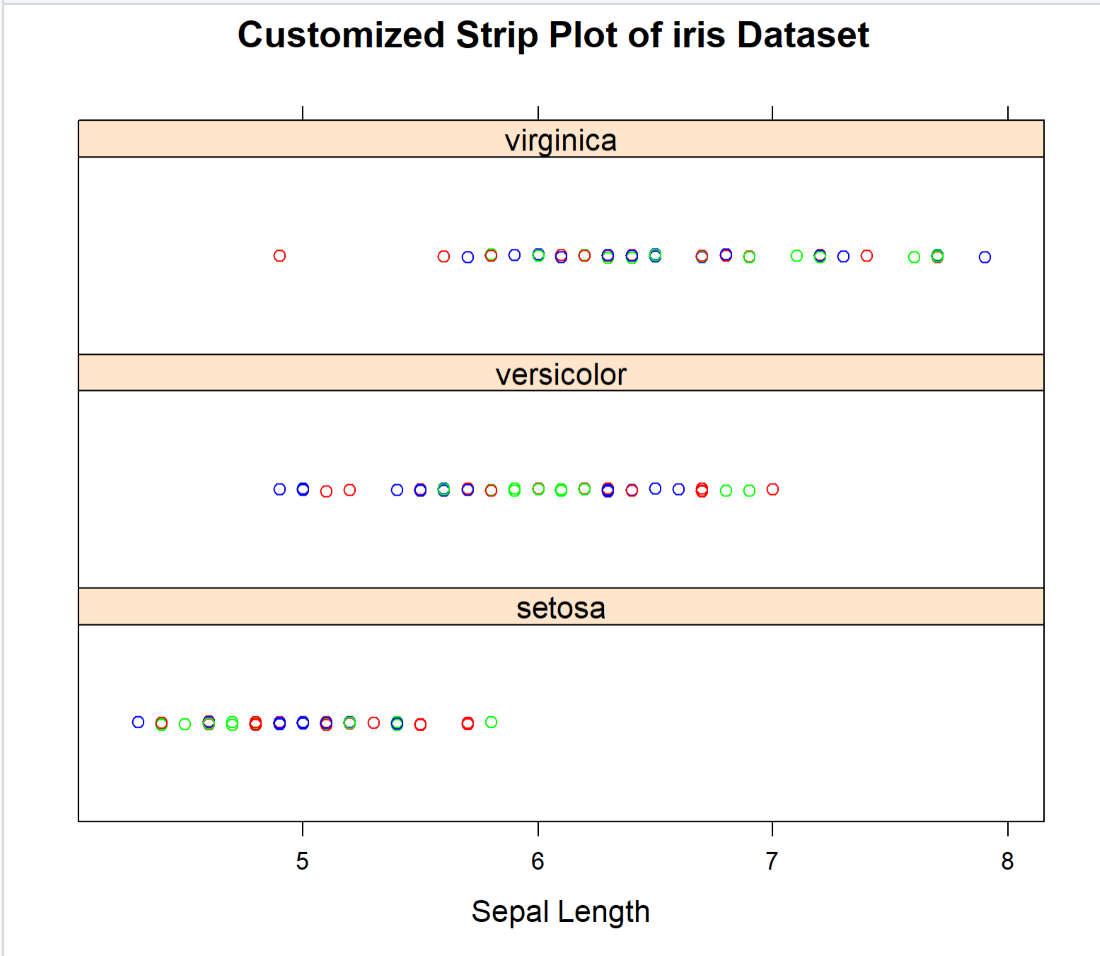
我们还可以使用col参数来定制图表。我们可以在图中添加不同的颜色。
# Install the required package
install.packages("lattice")
# Load the installed package
library(lattice)

# Load the default dataset(iris) into current working environment
data(iris)

# Plotting the Customized Strip plot using striplot()
lattice::stripplot(~Sepal.Length|Species, data=iris,
                   jitter=TRUE,layout=c(1,3), xlab="Sepal Length",
                   main="Customized Strip Plot of iris Dataset",
                   col=c("red","blue","green"))
输出

 极客教程
极客教程