R语言 ggplot2中boxplots之间的间距
在这篇文章中,我们将看到如何使用R编程语言在ggplot2中的boxplots之间添加空间。
使用的数据集: Crop_recommendation
方法1:在boxplot之间使用宽度
这里我们将使用宽度属性来定义boxplot之间的空间。在这里,值被传递给属性。
语法: geom_boxplot(width)
程序
library(ggplot2)

# loading data set and storing it in ds variable
df <- read.csv("Crop_recommendation.csv", header = TRUE)

# create a boxplot by using geom_boxplot() function
# of ggplot2 package
plot = ggplot(data=df,
              mapping=aes(
                x=label, y=temperature))+
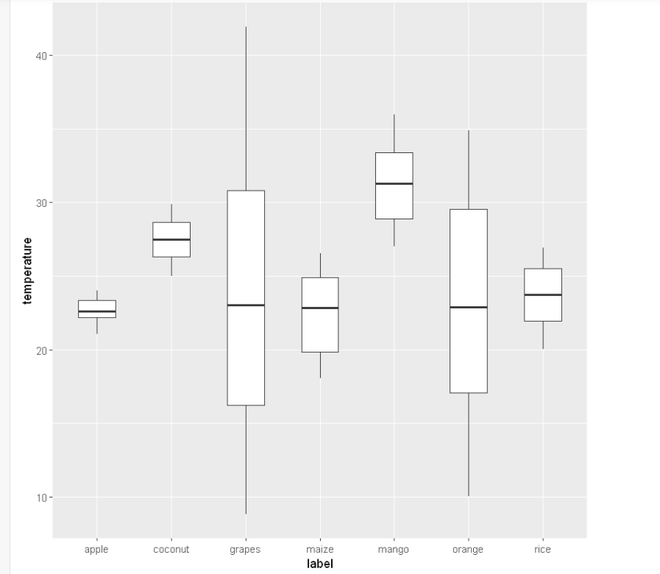
geom_boxplot(width = 0.5)
plot
输出
方法2:使用position_dodge
这里我们将使用position_dodge来定义一个几何体 的垂直位置 ,同时调整水平位置。 position_dodge()要求分组变量是指定位置 。
语法
geom_boxplot( position = position_dodge(width))
程序 。
library(ggplot2)

# loading data set and storing it in ds variable
df <- read.csv("Crop_recommendation.csv", header = TRUE)

# create a boxplot by using geom_boxplot() function
# of ggplot2 package
plot= ggplot(data=df,
             mapping=aes(x=label,
                         y=temperature))+
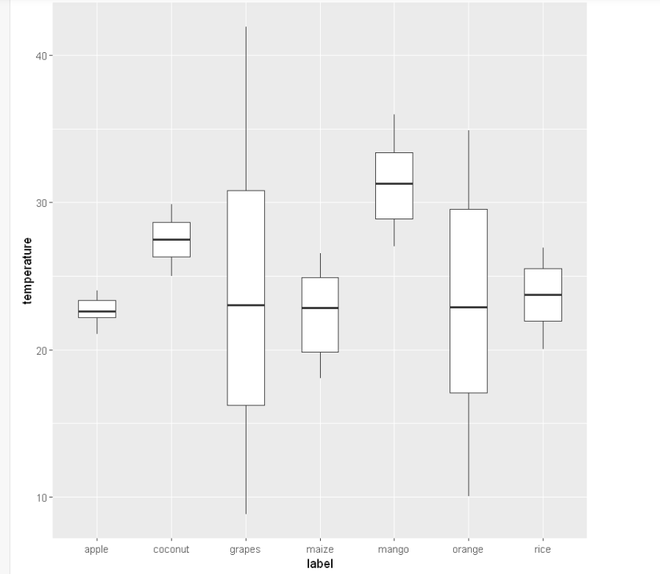
geom_boxplot(width=0.1, position = position_dodge(width=0.5))
plot
输出
 极客教程
极客教程
