用ggplot删除空面
一般来说,当人们通过划分子集来绘制总的数据集时,会用到切面。但是,由于数据集中存在一些空数据,图中可能会包含一些空的面。为了从图中移除这些空面,我们需要使用R编程中的facet_wrap()函数。
用ggplot去除空面的步骤。
第1步: 首先,我们需要安装并加载ggplot2软件包
# Install and load the ggplot package
install.packages("ggplot2")
library(ggplot2)
第2步: 创建样本数据框架
# Creation of sample data frame
df <- data.frame(x = 1:8,
                 # Each facet on x axis is able
                 # to represent 8 numbers
                   y = 1:8,
                 # Each facet on x axis is able
                 # to represent 8 numbers
                   g1 = rep(LETTERS[1:4], each = 2),
                 # The first four upper case letters
                 # are generated each twice
                   g2 = letters[1:4]
                 # The first four lower case letters
                 # are generated randomly
                )
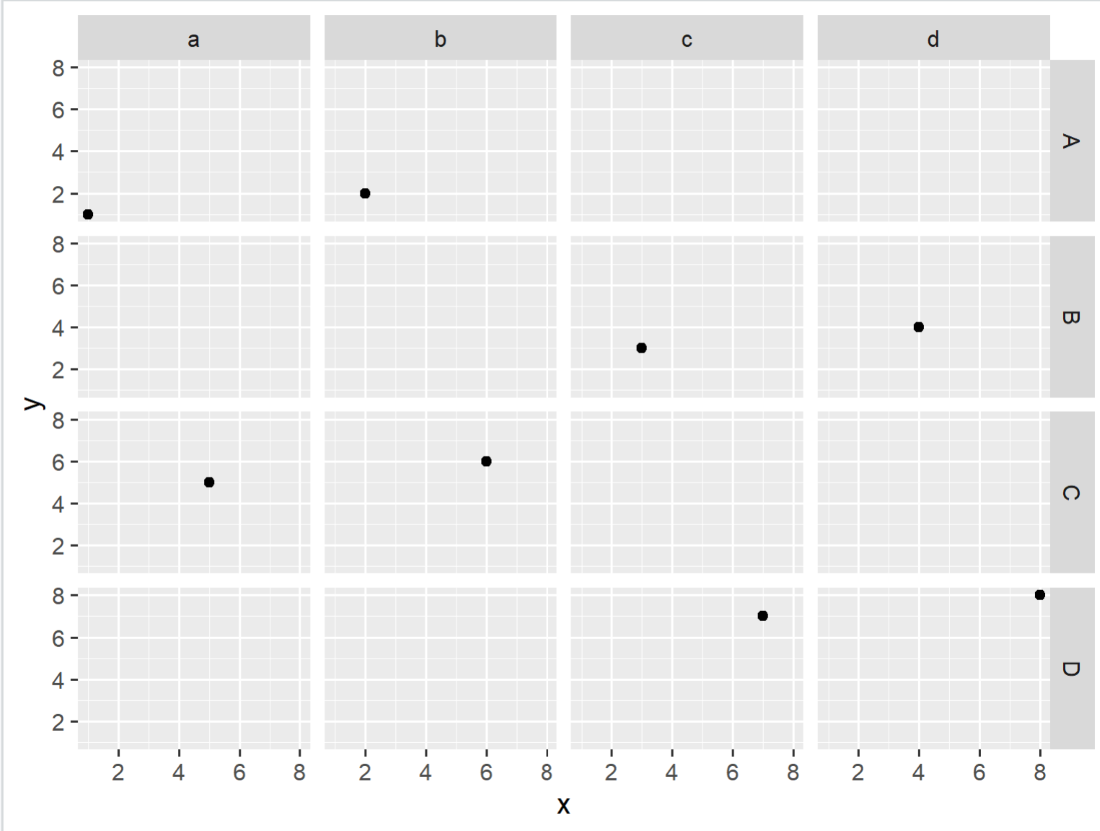
第3步: 使用ggplot和facet_grid()绘制分面图。facet_grid()是一个函数,用于将每个变量组合的绘图分解成网格,即使有些面是空的。
# Plotting the facet plot using gplot and facet_grid()
plot <- ggplot(df, aes(x, y)) +
  geom_point()+
  facet_grid(g1 ~ g2)
plot
输出

带有空面的图谱
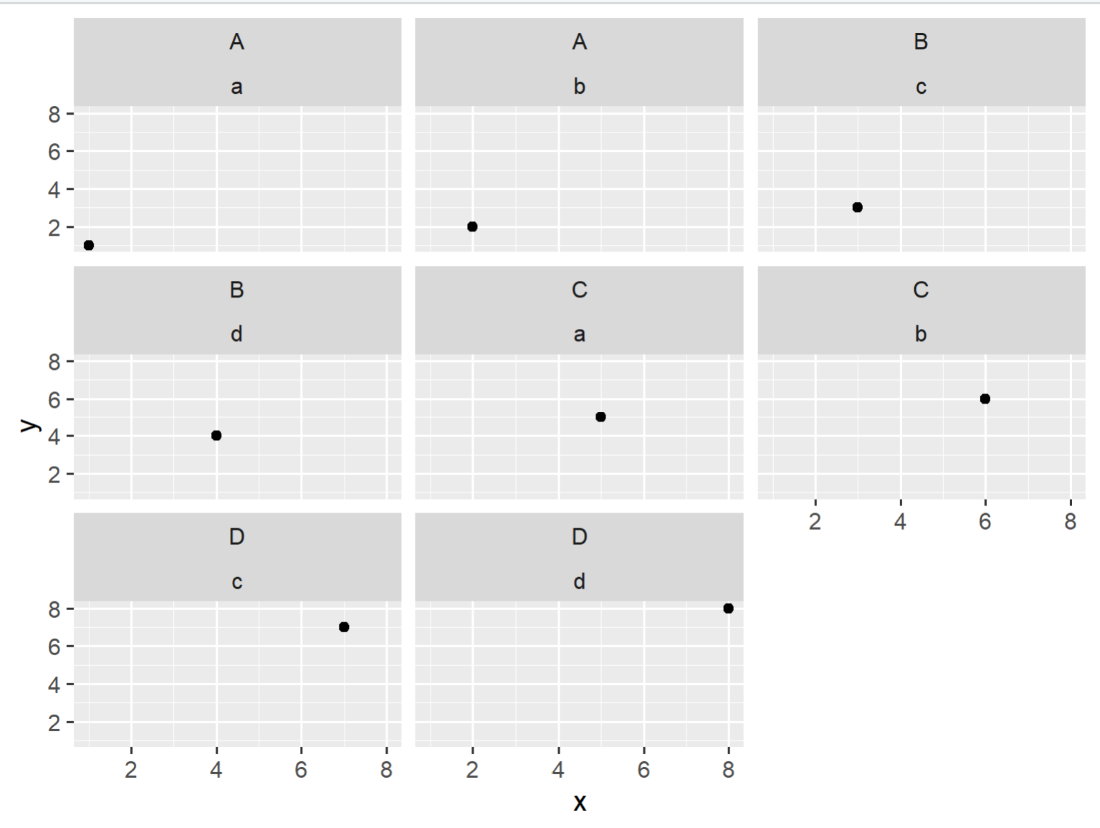
第4步: 从输出结果中我们可以看到有8个空面。为了消除这些空面,我们将使用facet_wrap()函数,该函数负责为只有数值的变量组合生成图。
# Removing empty facets from the plot using facet_wrap()
plot <- plot + facet_wrap(g1 ~ g2)
plot
输出

不含空面的图谱
 极客教程
极客教程