R中的多条形图
柱状图是对分组数据的一种视觉表现。它是数据分析活动中最常用的图表。在多条形图中,我们有各种水平和垂直矩形条形的条形图。在这些多条形图中,条形代表数字和分类变量之间的关系。让我们在以下例子的帮助下学习如何创建多条形图。
方法1:使用ggplot2包中的geom_bar()函数
geom_bar()函数用于为分类数据x创建条形图,为连续数据y创建柱状图。它内置在ggplot2包中,我们不需要单独安装它。
语法: geom_bar( mapping = NULL, data = NULL, stat = "count", position = "stack",.)
参数
- mapping: 映射可以通过 “ais() “创建,即审美映射,在这个映射中,我们提供列名作为参数,映射到绘图上。geom_bar中默认的映射是NULL。
- data: data是一个数据 **** 框架,我们将在绘图时使用。
- stat: stat代表统计,其默认值为count , 即我们将根据计数的多少来创建条形图。
- position: position参数指定条形图在视觉表现中的放置方式。位置的默认值是堆栈。
这里,位置参数被设置为一个适当的值,以产生相互并排的条形图。
例子 :
# creating multiple bar plots in R
library(ggplot2)

# creating a dummy dataset
number <- c(12,22,11,26,10,20,21,18)

gender <- c("Male","Female","Male","Female",
            "Female","Male","Female","Male")

friend_or_not <- c("Unknown","Friend","Unknown",
                   "Friend","Unknown","Friend",
                   "Unknown","Friend")

# creating data frame
circle <- data.frame(number,gender,friend_or_not)

# creating plot using the above data
ggplot(circle, aes(gender, number, fill = friend_or_not)) +
  geom_bar(stat="identity", position = "dodge") +
  labs(title="Multiple Bar plots")
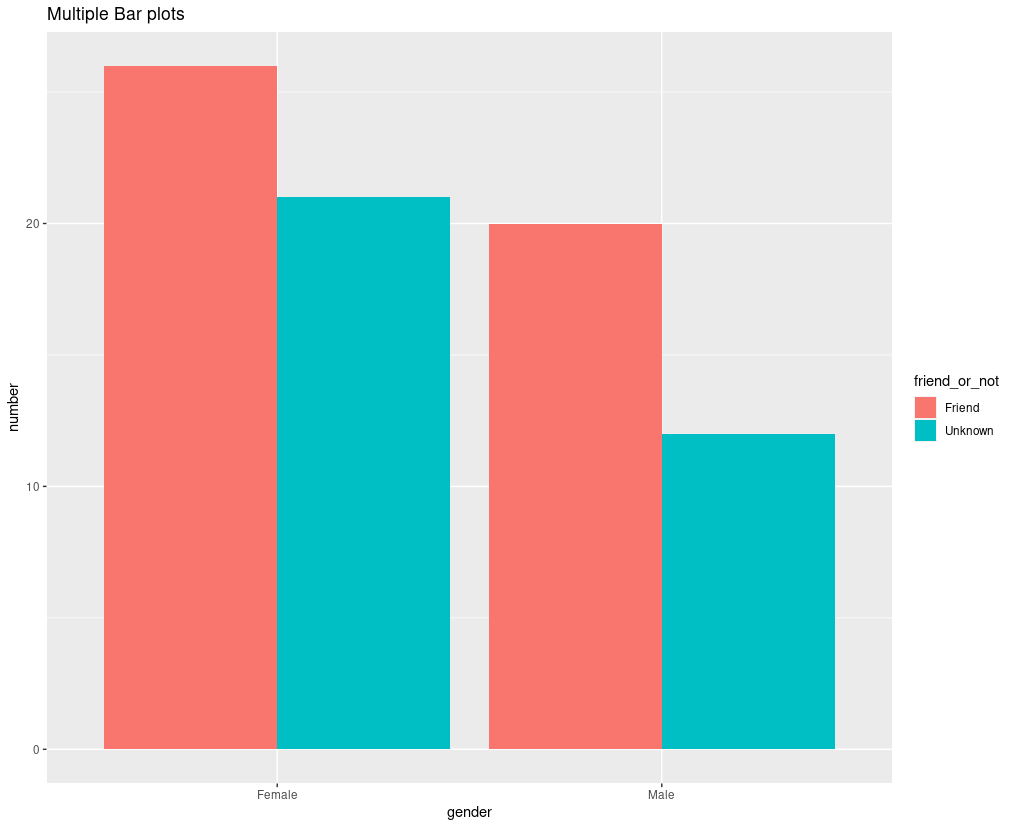
输出

使用geom_bar()绘制一个多条形图。
方法2:使用基础R包barplot()
我们可以使用barplot()函数在R编程语言中创建一个条形图。下面是创建条形图的语法。我们可以使用相同的条形图语法,并进行一些修改来创建多个条形图。
语法: barplot(data,main,xlab,ylab,..)
参数
- data:data 是 我们 的数据集名称或表名称。我们也可以在data中提供一个向量或矩阵作为参数。
- main: main用于显示柱状图的标题。
- xlab: xlab接收一个字符串作为参数,用于设置x轴的标签。
- ylab : ylab以一个字符串为参数,设置y轴的标签。
为了使图表并排排列,boxplot()的参数被设置为TRUE。
例子
# creating multiple bar plots in R

# creating a dummy data frame
barplot1=c(10,2,5,4,6,5,8,10,5,9)
barplot2=c(9,5,6,4,7,1,2,6,2,6)
barplot3=c(4,2,9,4,3,5,7,10,10,3)
data <- data.frame(barplot1,barplot2,barplot3)

# plotting multiple bar plots
barplot(as.matrix(data),
        main="Multiple Bar Plots",

        # setting y label only
        # because x-label will be our
        # barplots name
        ylab="Count",

        # to plot the bars vertically
        beside=TRUE,
)
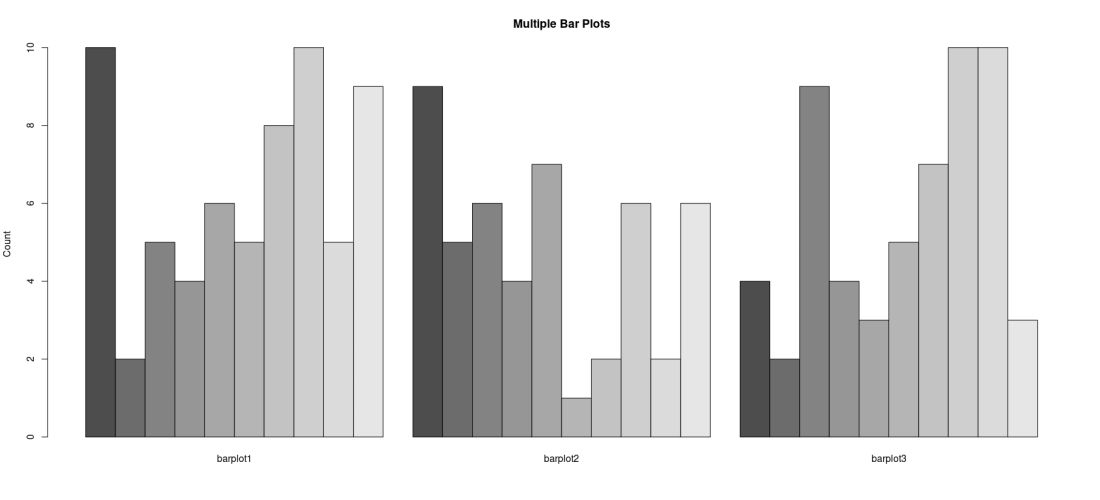
输出

多条形图
 极客教程
极客教程