学习R编程
R是一种编程语言,主要用于 机器学习、数据分析和统计计算。 它是一种解释性语言,与平台无关,这意味着它可以在Windows、Linux和MacOS等平台上使用。

在这个R语言教程中,我们将从头到尾地学习R编程语言,这个教程既适合初学者,也适合有经验的开发者)。
为什么要学习R编程语言
- R编程被用作机器学习、统计和数据分析的主要工具。
- R是一种开源语言,这意味着它是免费的,任何组织的人都可以安装它而不需要购买许可证。
- 它可以在windows、Linux和macOS等广泛使用的平台上使用。
- R编程语言不仅是一个统计包,而且还允许我们与其他语言(C,C++)集成。因此,你可以轻松地与许多数据源和统计包互动。
- 它的用户群与日俱增,并拥有庞大的社区支持。
- R编程语言是目前数据科学就业市场上最需要的编程语言之一,这使它成为当今最热门的趋势。

主要特点和应用
使得R成为数据科学市场上最需要的工作之一的一些关键特点是。
- 基本统计: 最常见的基本统计术语是平均值、模式和中位数。这些都被称为 “中心趋势的测量”。所以使用R语言,我们可以非常容易地测量中心趋势。
- 静态图形: R语言具有丰富的设施,可用于创建和开发各种静态图形,包括图形地图、马赛克图、双曲线图等,不胜枚举。
- 概率分布: 使用R可以很容易地处理各种类型的概率分布,如二项分布、正态分布、奇偶分布等等。
- R包: R的主要特点之一是它有大量的库可供选择。R有CRAN(Comprehensive R Archive Network),它是一个拥有超过10,000个包的资料库。
- 分布式计算: 分布式计算是一种模式,其中软件系统的组件在多台计算机之间共享以提高效率和性能。2015年11月发布了两个用于R的分布式编程的新包ddR和multidplyr。
R的应用

下载和安装
在本文中,我们将处理RStudio在R中的安装问题,有许多IDE可用于使用R。
请参考下面的文章,以获得关于RStudio及其安装的详细信息。
- 如何在Windows和Linux上安装R Studio?
- R Studio简介
- 在R Studio中创建和执行R文件
R语言 HelloWorld
R程序可以通过几种方式运行。你可以选择以下任何一种方式来继续学习本教程。
- 使用IDE,如RStudio、Eclipse、Jupyter、Notebook等。
- 使用R命令提示符
- 使用RS脚本
现在输入下面的代码,在你的控制台打印hello world。
# R Program to print
# Hello World

print("HelloWorld")
输出
[1] "HelloWorld"
注: 更多信息请参考《R编程中的Hello World》。
R的基础知识
变量。
R是一种动态类型的语言,也就是说,变量在声明时没有数据类型,而是采用分配给它们的R对象的数据类型。在R语言中,可以用三种方式表示赋值。
- 使用等价运算符– 数据从右向左复制。
variable_name = value
- 使用向左运算器– 数据从右向左复制。
variable_name <- value
- 使用向右运算器– 数据从左到右复制。
value -> variable_name
例子
# R program to illustrate
# Initialization of variables

# using equal to operator
var1 = "gfg"
print(var1)

# using leftward operator
var2 <- "gfg"
print(var2)

# using rightward operator
"gfg" -> var3
print(var3)
输出
[1] "gfg"
[1] "gfg"
[1] "gfg"
注: 更多信息请参考R – 变量 。
注释
注释是英文句子,用于在源代码中添加有用的信息,使读者更容易理解。它解释了代码中使用的逻辑部分,在执行过程中不会对代码产生影响。任何以 “#”开头的语句在R中都是注释。
例子
# all the lines starting with '#'
# are comments and will be ignored
# during the execution of the
# program

# Assigning values to variables
a <- 1
b <- 2

# Printing sum
print(a + b)
输出
[1] 3
注: 更多信息请参考R中的注释。
操作符
操作符是指导操作数之间可以进行的各种操作的符号。操作符模拟了对一组复数、整数和数值作为输入操作数进行的各种数学、逻辑和决策操作。这些都是根据它们的功能来分类的
- 算术运算符: 算术运算符模拟各种数学运算,如加法、减法、乘法、除法和模数。
例子
# R program to illustrate
# the use of Arithmetic operators
a <- 12
b <- 5

# Performing operations on Operands
cat ("Addition :", a + b, "\n")
cat ("Subtraction :", a - b, "\n")
cat ("Multiplication :", a * b, "\n")
cat ("Division :", a / b, "\n")
cat ("Modulo :", a %% b, "\n")
cat ("Power operator :", a ^ b)
输出
Addition : 17
Subtraction : 7
Multiplication : 60
Division : 2.4
Modulo : 2
Power operator : 248832
- 逻辑运算符: 逻辑运算符模拟元素明智的决策运算,基于操作数之间的指定运算符,然后被评估为真或假的布尔值。
例子
# R program to illustrate
# the use of Logical operators
vec1 <- c(FALSE, TRUE)
vec2 <- c(TRUE,FALSE)

# Performing operations on Operands
cat ("Element wise AND :", vec1 & vec2, "\n")
cat ("Element wise OR :", vec1 | vec2, "\n")
cat ("Logical AND :", vec1 && vec2, "\n")
cat ("Logical OR :", vec1 || vec2, "\n")
cat ("Negation :", !vec1)
输出
Element wise AND : FALSE FALSE
Element wise OR : TRUE TRUE
Logical AND : FALSE
Logical OR : TRUE
Negation : TRUE FALSE
- 关系运算符: 关系运算符在操作数的相应元素之间进行比较操作。
例子
# R program to illustrate
# the use of Relational operators
a <- 10
b <- 14

# Performing operations on Operands
cat ("a less than b :", a < b, "\n")
cat ("a less than equal to b :", a <= b, "\n")
cat ("a greater than b :", a > b, "\n")
cat ("a greater than equal to b :", a >= b, "\n")
cat ("a not equal to b :", a != b, "\n")
输出
a less than b : TRUE
a less than equal to b : TRUE
a greater than b : FALSE
a greater than equal to b : FALSE
a not equal to b : TRUE
- 赋值运算符: 赋值运算符用于为R中的各种数据对象赋值。
例子
# R program to illustrate
# the use of Assignment operators

# Left assignment operator
v1 <- "GeeksForGeeks"
v2 <<- "GeeksForGeeks"
v3 = "GeeksForGeeks"

# Right Assignment operator
"GeeksForGeeks" ->> v4
"GeeksForGeeks" -> v5

# Performing operations on Operands
cat("Value 1 :", v1, "\n")
cat("Value 2 :", v2, "\n")
cat("Value 3 :", v3, "\n")
cat("Value 4 :", v4, "\n")
cat("Value 5 :", v5)
输出
Value 1 : GeeksForGeeks
Value 2 : GeeksForGeeks
Value 3 : GeeksForGeeks
Value 4 : GeeksForGeeks
Value 5 : GeeksForGeeks
注: 更多信息,请参考R-操作者
关键词
关键词是R中特定的保留词,每一个都有一个与之相关的特定功能。下面是R语言中的关键词列表。
| if | function | FALSE | NA_integer |
|---|---|---|---|
| else | in | NULL | NA_real |
| while | next | Inf | NA_complex_ |
| repeat | break | NaN | NA_character_ |
| for | TRUE | NA | … |
数据类型
R中的每个变量都有一个相关的数据类型。每种数据类型需要不同数量的内存,并有一些可以对其进行的特定操作。R支持5种数据类型。它们是 –
| 数据类型 | 数据类型 | 说明 |
|---|---|---|
| 数值型 | 1, 2, 12, 36 | 十进制值在R中被称为数值,它是R中数字的默认数据类型。 |
| 整数 | 1L, 2L, 34L | R支持整数数据类型,它是所有整数的集合。大写的’L’符号作为后缀,用于表示一个特定的值是整数数据类型。 |
| 逻辑型 | TRUE, FALSE | 取值为真或假 |
| 复数 | 2+3i, 5+7i | 所有复数的集合。复数数据类型是用来存储具有虚数成分的数字。 |
| 字符 | ‘a’, ’12’, “GFG”, “‘hello”‘ | R支持字符数据类型,在这里你有所有的字母和特殊字符。 |
例子
# A simple R program
# to illustrate data type

print("Numberic type")
# Assign a decimal value to x
x = 12.25

# print the class name of variable
print(class(x))

# print the type of variable
print(typeof(x))

print("----------------------------")
print("Integer Type")
# Declare an integer by appending an
# L suffix.
y = 15L

# print the class name of y
print(class(y))

# print the type of y
print(typeof(y))

print("----------------------------")
print("Logical Type")
# Sample values
x = 1
y = 2

# Comparing two values
z = x > y

# print the logical value
print(z)

# print the class name of z
print(class(z))

# print the type of z
print(typeof(z))

print("----------------------------")
print("Complex Type")
# Assign a complex value to x
x = 12 + 13i

# print the class name of x
print(class(x))

# print the type of x
print(typeof(x))

print("----------------------------")
print("Character Type")

# Assign a character value to char
char = "GFG"

# print the class name of char
print(class(char))

# print the type of char
print(typeof(char))
输出
[1] "Numberic type"
[1] "numeric"
[1] "double"
[1] "----------------------------"
[1] "Integer Type"
[1] "integer"
[1] "integer"
[1] "----------------------------"
[1] "Logical Type"
[1] TRUE
[1] "logical"
[1] "logical"
[1] "----------------------------"
[1] "Complex Type"
[1] "complex"
[1] "complex"
[1] "----------------------------"
[1] "Character Type"
[1] "character"
[1] "character"
输入/输出的基础知识
从用户那里获取输入
R语言为我们提供了两个内置的函数来读取键盘上的输入。
- readline()方法: 它接受字符串格式的输入。如果输入的是一个整数,那么它将被输入为一个字符串。
例子
# R program to illustrate
# taking input from the user

# taking input using readline()
# this command will prompt you
# to input a desired value
var = readline();
- scan()方法: 该方法以向量或列表的形式读取数据。当需要为任何数学计算或任何数据集快速获取输入时,这个方法是一个非常方便的方法。
例子
# R program to illustrate
# taking input from the user

# taking input using scan()
x = scan()
打印输出到控制台
R提供了各种函数将输出写到屏幕上,让我们来看看它们 —
- print(): 这是最常见的打印输出的方法。
例子
# R program to illustrate
# printing output of an R program

# print string
print("Hello")

# print variable
# it will print 'GeeksforGeeks' on
# the console
x <- "Welcome to GeeksforGeeks"
print(x)
输出
[1] "Hello"
[1] "Welcome to GeeksforGeeks"
- cat(): cat()将其参数转换为字符串。这对打印用户定义函数的输出很有用。
例子
# R program to illustrate
# printing output of an R
# program

# print string with variable
# "\n" for new line
x = "Hello"
cat(x, "\nwelcome")

# print normal string
cat("\nto GeeksForGeeks")
输出
Hello
welcome
to GeeksForGeeks
决策制定
决策是根据某些条件决定程序的执行流程。在决策中,程序员需要提供一些由程序评估的条件,同时还提供一些如果条件为真则执行的语句,如果条件被评估为假则可选择其他语句。
R语言中的决策语句
- if 语句
- if-else 语句
- if-else-if 梯子
- 嵌套的if-else语句
- 开关语句
例1: 演示if和if-else
# R program to illustrate
# decision making

a <- 99
b <- 12

# if statement to check whether
# the number a is larger or not
if(a > b)
{
    print("A is Larger")
}


# if-else statement to check which
# number is greater
if(b > a)
{
    print("B is Larger")
} else
{
    print("A is Larger")
}
输出
[1] "A is Larger"
[1] "A is Larger"
例2: 演示if-else-if和嵌套if
# R program to demonstrate
# decision making

a <- 10

# is-elif
if (a == 11)
{
    print ("a is 11")
} else if (a==10)
{
    print ("a is 10")
} else
    print ("a is not present")

# Nested if to check whether a
# number is divisible by both 2 and 5
if (a %% 2 == 0)
{
    if (a %% 5 == 0)
        print("Number is divisible by both 2 and 5")
}
输出
[1] "a is 10"
[1] "Number is divisible by both 2 and 5"
例子3: 演示开关
# R switch statement example

# Expression in terms of the index value
x <- switch(
    2,             # Expression
    "Welcome",     # case 1
    "to",         # case 2
    "GFG"         # case 3
)
print(x)

# Expression in terms of the string value
y <- switch(
    "3",                 # Expression
    "0"="Welcome",     # case 1
    "1"="to",         # case 2
    "3"="GFG"         # case 3
)
print(y)

z <- switch(
    "GfG",                 # Expression
    "GfG0"="Welcome",     # case 1
    "GfG1"="to",         # case 2
    "GfG3"="GFG"         # case 3
)
print(z)
输出
[1] "to"
[1] "GFG"
NULL
控制流
循环用于我们必须重复执行一个语句块的地方。例如,打印 “hello world “10次。R语言中不同类型的循环有
- For 循环
例子
# R Program to demonstrate the use of
# for loop along with concatenate
for (i in c(-8, 9, 11, 45))
{
    print(i)
}
输出
[1] -8
[1] 9
[1] 11
[1] 45
- While 循环
例子
# R program to demonstrate the
# use of while loop

val = 1

# using while loop
while (val <= 5 )
{
    # statements
    print(val)
    val = val + 1
}
输出
[1] 1
[1] 2
[1] 3
[1] 4
[1] 5
- repeat循环
例子
# R program to demonstrate the use
# of repeat loop

val = 1

# using repeat loop
repeat
{
    # statements
    print(val)
    val = val + 1

    # checking stop condition
    if(val > 5)
    {
        # using break statement
        # to terminate the loop
        break
    }
}
输出
[1] 1
[1] 2
[1] 3
[1] 4
[1] 5
循环控制语句
循环控制语句改变了其正常的执行顺序。以下是R语言提供的循环控制语句。
- Break语句: break关键字是一个跳转语句,用于在特定的迭代中终止循环。
- Next语句: Next语句用于跳过循环中的当前迭代,进入下一个迭代,而不从循环本身退出。
# R program for break statement
no <- 15:20

for (val in no)
{
    if (val == 17)
    {
        break
    }
    print(paste("Values are: ", val))
}

print("------------------------------------")

# R Next Statement Example
for (val in no)
{
    if (val == 17)
    {
        next
    }
    print(paste("Values are: ", val))
}
输出
[1] "Values are:  15"
[1] "Values are:  16"
[1] "------------------------------------"
[1] "Values are:  15"
[1] "Values are:  16"
[1] "Values are:  18"
[1] "Values are:  19"
[1] "Values are:  20"
函数
函数是一个代码块,它给用户提供了重复使用相同代码的能力,从而节省了对内存的过度使用,并为代码提供了更好的可读性。因此,基本上,一个函数是一个语句的集合,执行一些特定的任务并将结果返回给调用者。在R中,通过使用命令 function() 关键字,可以创建函数
例子
# A simple R program to
# demonstrate functions

ask_user = function(x){
    print("GeeksforGeeks")
}

my_func = function(x){
    a <- 1:5
    b <- 0

    for (i in a){
        b = b +1
    }
    return(b)
}

ask_user()
res = my_func()
print(res)
输出
[1] "GeeksforGeeks"
[1] 5
带参数的函数
函数的参数可以在定义函数时指定,在函数名之后,括号内。
例子
# A simple R function to check
# whether x is even or odd

evenOdd = function(x){
    if(x %% 2 == 0)

        # return even if the number
        # is even
        return("even")
    else

        # return odd if the number
        # is odd
        return("odd")
}

# Function definition
# To check a is divisible by b or not
divisible <- function(a, b){
    if(a %% b == 0)
    {
        cat(a, "is divisible by", b, "\n")
    } else
    {
        cat(a, "is not divisible by", b, "\n")
    }
}

# function with single argument
print(evenOdd(4))
print(evenOdd(3))

# function with multiple arguments
divisible(7, 3)
divisible(36, 6)
divisible(9, 2)
输出
[1] "even"
[1] "odd"
7 is not divisible by 3
36 is divisible by 6
9 is not divisible by 2
- 默认参数: 函数中的默认值是指每次调用函数时不需要指定的值。
例如
# Function definition to check
# a is divisible by b or not.

# If b is not provided in function call,
# Then divisibility of a is checked
# with 3 as default
isdivisible <- function(a, b = 9){
    if(a %% b == 0)
    {
        cat(a, "is divisible by", b, "\n")
    } else
    {
        cat(a, "is not divisible by", b, "\n")
    }
}

# Function call
isdivisible(20, 2)
isdivisible(12)
输出
20 is divisible by 2
12 is not divisible by 9
- 可变长度的参数: 圆点参数(…)也被称为省略号,它允许函数接受未定义的参数数量。
例子
# Function definition of dots operator
fun <- function(n, ...){
    l <- c(n, ...)
    paste(l, collapse = " ")
}

# Function call
fun(5, 1L, 6i, TRUE, "GFG", 1:2)
输出
5 1 0+6i TRUE GFG 1 2
数据结构
数据结构是在计算机中组织数据的一种特殊方式,以便能够有效地使用它。
向量
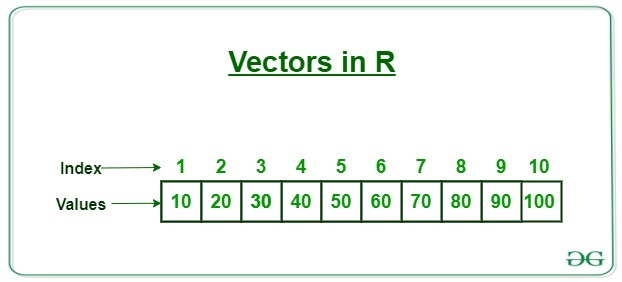
R语言中的矢量与C语言中的数组相同,用于保存同一类型的多个数据值。一个主要的关键点是,在R语言中,向量的索引将从 “1 “开始,而不是从 “0 “开始。
例子
# R program to illustrate Vector

# Numeric Vector
N = c(1, 3, 5, 7, 8)

# Character vector
C = c('Geeks', 'For', 'Geeks')

# Logical Vector
L = c(TRUE, FALSE, FALSE, TRUE)

# Printing vectors
print(N)
print(C)
print(L)
输出
[1] 1 3 5 7 8
[1] "Geeks" "For"   "Geeks"
[1]  TRUE FALSE FALSE  TRUE
访问矢量元素
我们可以通过很多方式来访问向量的元素。最常见的是使用'[]’,符号。
例子
# Accessing elements using
# the position number.
X <- c(2, 9, 8, 0, 5)
print('using Subscript operator')
print(X[2])

# Accessing specific values by passing
# a vector inside another vector.
Y <- c(6, 2, 7, 4, 0)
print('using c function')
print(Y[c(4, 1)])

# Logical indexing
Z <- c(1, 6, 9, 4, 6)
print('Logical indexing')
print(Z[Z>3])
输出
[1] "using Subscript operator"
[1] 9
[1] "using c function"
[1] 4 6
[1] "Logical indexing"
[1] 6 9 4 6
列表
列表是一个通用对象,由对象的有序集合组成。列表是异质性的数据结构。
例子
# R program to create a List

# The first attributes is a numeric vector
# containing the employee IDs which is created
# using the command here
empId = c(1, 2, 3, 4)

# The second attribute is the employee name
# which is created using this line of code here
# which is the character vector
empName = c("Nisha", "Nikhil", "Akshu", "Sambha")

# The third attribute is the number of employees
# which is a single numeric variable.
numberOfEmp = 4

# The fourth attribute is the name of organization
# which is a single character variable.
Organization = "GFG"

# We can combine all these three different
# data types into a list
# containing the details of employees
# which can be done using a list command
empList = list(empId, empName, numberOfEmp, Organization)

print(empList)
输出
[[1]]
[1] 1 2 3 4

[[2]]
[1] "Nisha"  "Nikhil" "Akshu"  "Sambha"

[[3]]
[1] 4

[[4]]
[1] "GFG"
访问列表元素
- 通过名称访问组件: 一个列表中的所有组件都可以被命名,我们可以使用这些名称来使用美元命令访问列表中的组件。
- 通过索引访问组件: 我们也可以使用索引访问列表中的组件。如果我们想访问列表中的顶层组件,我们必须使用双片运算符”[[]]”,也就是两个方括号,如果我们想访问列表中的低层或内层组件,我们必须使用另一个方括号”[]”和双片运算符”[[]”。
例子
# R program to access
# components of a list

# Creating a list by naming all its components
empId = c(1, 2, 3, 4)
empName = c("Nisha", "Nikhil", "Akshu", "Sambha")
numberOfEmp = 4
empList = list(
"ID" = empId,
"Names" = empName,
"Total Staff" = numberOfEmp
)
print("Initial List")
print(empList)

# Accessing components by names
cat("\nAccessing name components using command\n")
print(empListNames)

# Accessing a top level components by indices
cat("\nAccessing name components using indices\n")
print(empList[[2]])
print(empList[[1]][2])
print(empList[[2]][4])
输出
[1] "Initial List"
ID
[1] 1 2 3 4Names
[1] "Nisha"  "Nikhil" "Akshu"  "Sambha"

`Total Staff`
[1] 4


Accessing name components using command
[1] "Nisha"  "Nikhil" "Akshu"  "Sambha"

Accessing name components using indices
[1] "Nisha"  "Nikhil" "Akshu"  "Sambha"
[1] 2
[1] "Sambha"
添加和修改列表元素
- 列表也可以通过访问组件并将其替换为你想要的组件来进行修改。
- 列表元素可以通过使用新的标签分配新的值来简单地添加。
例子
# R program to access
# components of a list

# Creating a list by naming all its components
empId = c(1, 2, 3, 4)
empName = c("Nisha", "Nikhil", "Akshu", "Sambha")
numberOfEmp = 4
empList = list(
"ID" = empId,
"Names" = empName,
"Total Staff" = numberOfEmp
)
print("Initial List")
print(empList)

# Adding new element
empList[["organization"]] <- "GFG"
cat("\nAfter adding new element\n")
print(empList)

# Modifying the top-level component
empList$"Total Staff" = 5

# Modifying inner level component
empList[[1]][5] = 7

cat("\nAfter modification\n")
print(empList)
输出
[1] "Initial List"
ID
[1] 1 2 3 4Names
[1] "Nisha"  "Nikhil" "Akshu"  "Sambha"

`Total Staff`
[1] 4


After adding new elementID
[1] 1 2 3 4

Names
[1] "Nisha"  "Nikhil" "Akshu"  "Sambha"`Total Staff`
[1] 4

organization
[1] "GFG"


After modificationID
[1] 1 2 3 4 7

Names
[1] "Nisha"  "Nikhil" "Akshu"  "Sambha"`Total Staff`
[1] 5

$organization
[1] "GFG"
矩阵
矩阵是数字在行和列中的一种矩形排列。矩阵是二维的、同质的数据结构。
例子
# R program to illustrate a matrix

A = matrix(
    # Taking sequence of elements
    c(1, 4, 5, 6, 3, 8),

    # No of rows and columns
    nrow = 2, ncol = 3,

    # By default matrices are
    # in column-wise order
    # So this parameter decides
    # how to arrange the matrix
    byrow = TRUE
)

print(A)
输出
     [,1] [,2] [,3]
[1,]    1    4    5
[2,]    6    3    8
访问矩阵元素 。
矩阵元素可以使用矩阵名称,后面是方括号,中间是逗号。逗号前的值用于访问行,逗号后的值用于访问列。
例子
# R program to illustrate
# access rows in metrics

# Create a 3x3 matrix
A = matrix(
c(1, 4, 5, 6, 3, 8),
nrow = 2, ncol = 3,
byrow = TRUE
)
cat("The 2x3 matrix:\n")
print(A)

print(A[1, 1])
print(A[2, 2])

# Accessing first and second row
cat("Accessing first and second row\n")
print(A[1:2, ])

# Accessing first and second column
cat("\nAccessing first and second column\n")
print(A[, 1:2])
输出
The 2x3 matrix:
     [,1] [,2] [,3]
[1,]    1    4    5
[2,]    6    3    8
[1] 1
[1] 3
Accessing first and second row
     [,1] [,2] [,3]
[1,]    1    4    5
[2,]    6    3    8

Accessing first and second column
     [,1] [,2]
[1,]    1    4
[2,]    6    3
修改矩阵元素
你可以通过直接赋值来修改矩阵的元素。
例子
# R program to illustrate
# editing elements in metrics

# Create a 3x3 matrix
A = matrix(
    c(1, 4, 5, 6, 3, 8),
    nrow = 2,
    ncol = 3,
    byrow = TRUE
)
cat("The 2x3 matrix:\n")
print(A)

# Editing the 3rd rows and 3rd
# column element from 9 to 30
# by direct assignments
A[2, 1] = 30

cat("After edited the matrix\n")
print(A)
输出
The 2x3 matrix:
     [,1] [,2] [,3]
[1,]    1    4    5
[2,]    6    3    8
After edited the matrix
     [,1] [,2] [,3]
[1,]    1    4    5
[2,]   30    3    8
DataFrame:
数据框架是R语言的通用数据对象,用于存储表格数据。它们是二维的、异质的数据结构。这些是长度相等的向量列表。
例子
# R program to illustrate dataframe

# A vector which is a character vector
Name = c("Nisha", "Nikhil", "Raju")

# A vector which is a character vector
Language = c("R", "Python", "C")

# A vector which is a numeric vector
Age = c(40, 25, 10)

# To create dataframe use data.frame command
# and then pass each of the vectors
# we have created as arguments
# to the function data.frame()
df = data.frame(Name, Language, Age)

print(df)
输出
    Name Language Age
1  Nisha        R  40
2 Nikhil   Python  25
3   Raju        C  10
从DataFrame中获取结构和数据
- 人们可以使用str()函数获得数据框的结构。
- 人们可以使用列名从数据框中提取一个特定的列。
例子
# R program to get the
# structure of the data frame

# creating a data frame
friend.data <- data.frame(
    friend_id = c(1:5),
    friend_name = c("Aman", "Nisha",
                    "Nikhil", "Raju",
                    "Raj"),
    stringsAsFactors = FALSE
)
# using str()
print(str(friend.data))

# Extracting friend_name column
result <- data.frame(friend.data$friend_name)
print(result)
输出
'data.frame':    5 obs. of  2 variables:
 friend_id  : int  1 2 3 4 5 friend_name: chr  "Aman" "Nisha" "Nikhil" "Raju" ...
NULL
  friend.data.friend_name
1                    Aman
2                   Nisha
3                  Nikhil
4                    Raju
5                     Raj
数据框架的摘要
通过应用summary()函数,可以获得数据的统计摘要和性质。
例子
# R program to get the
# structure of the data frame

# creating a data frame
friend.data <- data.frame(
    friend_id = c(1:5),
    friend_name = c("Aman", "Nisha",
                    "Nikhil", "Raju",
                    "Raj"),
    stringsAsFactors = FALSE
)
# using summary()
print(summary(friend.data))
输出
   friend_id friend_name
 Min.   :1   Length:5
 1st Qu.:2   Class :character
 Median :3   Mode  :character
 Mean   :3
 3rd Qu.:4
 Max.   :5
数组
数组是R的数据对象,它在两个以上的维度上存储数据。数组是n维的数据结构。
例子
# R program to illustrate an array

A = array(
    # Taking sequence of elements
    c(2, 4, 5, 7, 1, 8, 9, 2),

    # Creating two rectangular matrices
    # each with two rows and two columns
    dim = c(2, 2, 2)
)

print(A)
输出
, , 1

     [,1] [,2]
[1,]    2    5
[2,]    4    7

, , 2

     [,1] [,2]
[1,]    1    9
[2,]    8    2
访问数组
可以通过使用由逗号分隔的不同维度的索引来访问数组。不同的组件可以通过元素的名称或位置的任何组合来指定。
例子
vec1 <- c(2, 4, 5, 7, 1, 8, 9, 2)
vec2 <- c(12, 21, 34)

row_names <- c("row1", "row2")
col_names <- c("col1", "col2", "col3")
mat_names <- c("Mat1", "Mat2")

arr = array(c(vec1, vec2), dim = c(2, 3, 2),
            dimnames = list(row_names,
                            col_names, mat_names))

# accessing matrix 1 by index value
print ("Matrix 1")
print (arr[,,1])

# accessing matrix 2 by its name
print ("Matrix 2")
print(arr[,,"Mat2"])

# accessing matrix 1 by index value
print ("1st column of matrix 1")
print (arr[, 1, 1])

# accessing matrix 2 by its name
print ("2nd row of matrix 2")
print(arr["row2",,"Mat2"])

# accessing matrix 1 by index value
print ("2nd row 3rd column matrix 1 element")
print (arr[2, "col3", 1])

# accessing matrix 2 by its name
print ("2nd row 1st column element of matrix 2")
print(arr["row2", "col1", "Mat2"])

# print elements of both the rows and columns
# 2 and 3 of matrix 1
print (arr[, c(2, 3), 1])
输出
[1] "Matrix 1"
     col1 col2 col3
row1    2    5    1
row2    4    7    8
[1] "Matrix 2"
     col1 col2 col3
row1    9   12   34
row2    2   21    2
[1] "1st column of matrix 1"
row1 row2
   2    4
[1] "2nd row of matrix 2"
col1 col2 col3
   2   21    2
[1] "2nd row 3rd column matrix 1 element"
[1] 8
[1] "2nd row 1st column element of matrix 2"
[1] 2
     col2 col3
row1    5    1
row2    7    8
向数组添加元素
元素可以被添加到数组中的不同位置。元素的顺序是按照它们被添加到数组中的顺序保留的。在R中,有各种内置的函数可以用来添加新的值。
- c(vector, values)
- append(vector, values)。
- 使用数组的长度函数
例子
# creating a uni-dimensional array
x <- c(1, 2, 3, 4, 5)

# addition of element using c() function
x <- c(x, 6)
print ("Array after 1st modification ")
print (x)

# addition of element using append function
x <- append(x, 7)
print ("Array after 2nd modification ")
print (x)

# adding elements after computing the length
len <- length(x)
x[len + 1] <- 8
print ("Array after 3rd modification ")
print (x)

# adding on length + 3 index
x[len + 3]<-9
print ("Array after 4th modification ")
print (x)

# append a vector of values to the
# array after length + 3 of array
print ("Array after 5th modification")
x <- append(x, c(10, 11, 12), after = length(x)+3)
print (x)

# adds new elements after 3rd index
print ("Array after 6th modification")
x <- append(x, c(-1, -1), after = 3)
print (x)
输出
[1] "Array after 1st modification "
[1] 1 2 3 4 5 6
[1] "Array after 2nd modification "
[1] 1 2 3 4 5 6 7
[1] "Array after 3rd modification "
[1] 1 2 3 4 5 6 7 8
[1] "Array after 4th modification "
 [1]  1  2  3  4  5  6  7  8 NA  9
[1] "Array after 5th modification"
 [1]  1  2  3  4  5  6  7  8 NA  9 10 11 12
[1] "Array after 6th modification"
 [1]  1  2  3 -1 -1  4  5  6  7  8 NA  9 10 11 12
从数组中移除元素
- 在R语言中,可以从数组中移除元素,可以一次移除一个,也可以多个一起移除。这些元素被指定为数组的索引,其中满足条件的数组值被保留,其余被移除。
- 另一种移除元素的方法是使用 %in% 操作符,其中属于操作符的TRUE值的元素值的集合被显示为结果,其余的被移除。
例子
# creating an array of length 9
m <- c(1, 2, 3, 4, 5, 6, 7, 8, 9)
print ("Original Array")
print (m)

# remove a single value element:3
# from array
m <- m[m != 3]
print ("After 1st modification")
print (m)

# removing elements based on condition
# where either element should be
# greater than 2 and less than equal
# to 8
m <- m[m>2 & m<= 8]
print ("After 2nd modification")
print (m)

# remove sequence of elements using
# another array
remove <- c(4, 6, 8)

# check which element satisfies the
# remove property
print (m % in % remove)
print ("After 3rd modification")
print (m [! m % in % remove])
输出
[1] "Original Array"
[1] 1 2 3 4 5 6 7 8 9
[1] "After 1st modification"
[1] 1 2 4 5 6 7 8 9
[1] "After 2nd modification"
[1] 4 5 6 7 8
[1]  TRUE FALSE  TRUE FALSE  TRUE
[1] "After 3rd modification"
[1] 5 7
因子
因子是用来对数据进行分类并将其存储为等级的数据对象。它们对于存储分类数据非常有用。
例子
# Creating a vector
x<-c("female", "male", "other", "female", "other")

# Converting the vector x into
# a factor named gender
gender<-factor(x)
print(gender)
输出
[1] female male   other  female other
Levels: female male other
访问因子的 元素。
就像我们访问向量的元素一样,我们访问因子的元素的方式也是如此
例子
x<-c("female", "male", "other", "female", "other")
print(x[3])
输出
[1] "other"
修改一个因子
一个因素形成后,它的组成部分可以被修改,但需要分配的新值必须是在预定的水平。
例子
x<-c("female", "male", "other", "female", "other")
x[1]<-"male"
print(x)
输出
[1] "male" "male" "other" "female" "other"
错误处理
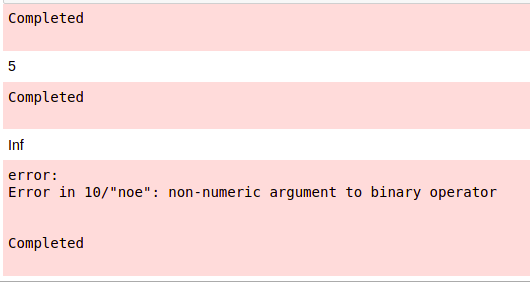
错误处理是一个过程,在这个过程中我们要处理不需要的或异常的错误,这些错误可能会在程序执行过程中导致异常终止。在R
- stop() 函数将产生错误
- stopifnot() 函数将接受一个逻辑表达式,如果其中任何一个表达式是FALSE,那么它将产生错误,指明哪个表达式是FALSE。
- warning() 将产生警告,但不会停止执行。
错误处理可以用 tryCatch() 来完成 。 这个函数的第一个参数是表达式,后面是指定如何处理条件的条件。
语法
check = tryCatch({
   expression
}, warning = function(w){
   code that handles the warnings
}, error = function(e){
   code that handles the errors
}, finally = function(f){
   clean-up code
})
例子
# R program illustrating error handling

# Evaluation of tryCatch
check <- function(expression){

  tryCatch(expression,

         warning = function(w){
           message("warning:\n", w)
         },
         error = function(e){
           message("error:\n", e)
         },
         finally = {
           message("Completed")
         })
}

check({10/2})
check({10/0})
check({10/'noe'})
输出
图表和图形
在现实世界中,每天都会产生大量的数据,因此,解释这些数据可能会有些忙乱。在这里, 数据可视化 开始发挥作用,因为通过图表和图形将数据可视化,以获得有意义的见解,而不是筛选庞大的Excel表格,总是更好的。让我们看看R编程中的一些基本图。
条形图
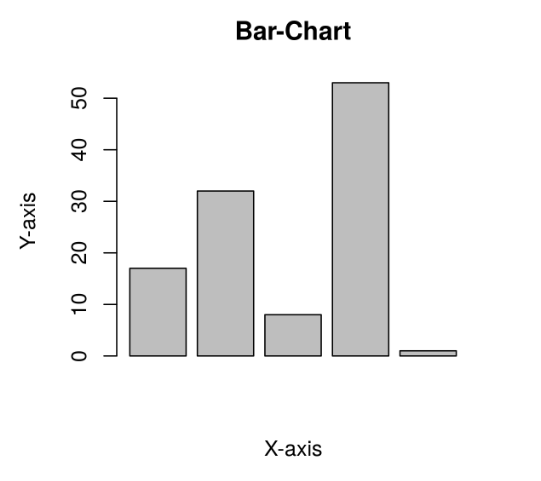
R使用函数barplot()来创建条形图。在这里,垂直和水平条都可以被绘制。
例子
# Create the data for the chart
A <- c(17, 32, 8, 53, 1)

# Plot the bar chart
barplot(A, xlab = "X-axis", ylab = "Y-axis",
        main ="Bar-Chart")
输出
注: 更多信息请参考R中的柱状图
柱状图
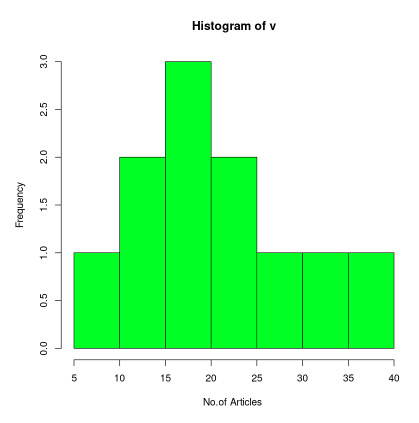
R使用hist()函数创建柱状图。
例子
# Create data for the graph.
v <- c(19, 23, 11, 5, 16, 21, 32,
       14, 19, 27, 39)

# Create the histogram.
hist(v, xlab = "No.of Articles ",
     col = "green", border = "black")
输出
注: 更多信息请参考R语言中的柱状图
散点图
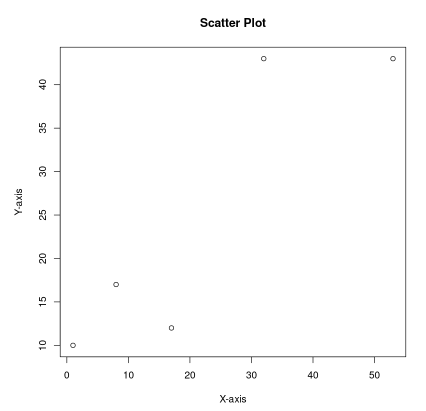
简单的散点图是用plot()函数创建的。
例子
# Create the data for the chart
A <- c(17, 32, 8, 53, 1)
B <- c(12, 43, 17, 43, 10)


# Plot the bar chart
plot(x=A, y=B, xlab = "X-axis", ylab = "Y-axis",
        main ="Scatter Plot")
输出
注: 更多信息请参考R语言中的散点图
线形图
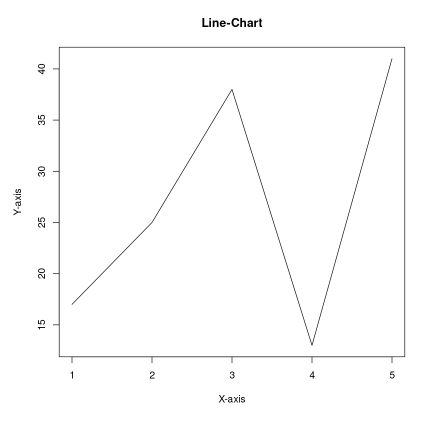
R语言中的plot()函数被用来创建折线图。
例子
# Create the data for the chart.
v <- c(17, 25, 38, 13, 41)

# Plot the bar chart.
plot(v, type = "l", xlab = "X-axis", ylab = "Y-axis",
        main ="Line-Chart")
输出
注: 更多信息请参考R语言中的线图。
饼图
R使用函数pie()来创建饼图。它将正数作为一个向量输入。
例子
# Create data for the graph.
geeks<- c(23, 56, 20, 63)
labels <- c("Mumbai", "Pune", "Chennai", "Bangalore")

# Plot the chart.
pie(geeks, labels)
输出

膨胀图
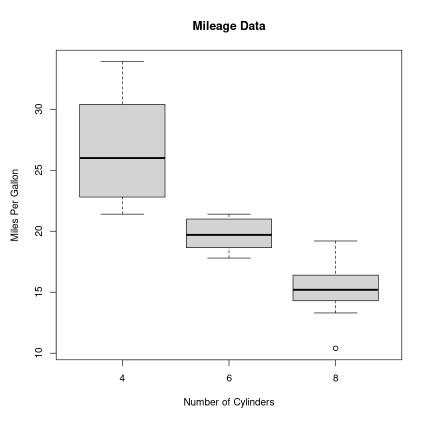
通过使用boxplot()函数,可以在R语言中创建膨胀图。
input <- mtcars[, c('mpg', 'cyl')]

# Plot the chart.
boxplot(mpg ~ cyl, data = mtcars,
        xlab = "Number of Cylinders",
        ylab = "Miles Per Gallon",
        main = "Mileage Data")
输出
统计学
统计学的意思是数字数据,是数学的一个领域,通常处理数据的收集、制表和数字数据的解释。它是应用数学的一个领域,关注数据的收集、分析、解释和展示。统计学涉及到如何利用数据来解决复杂的问题。
平均数、中位数和模式。
- 平均值: 它是观察值的总和除以观察值的总数。
- 中位数: 它是数据集的中间值。
- 模式: 它是在给定数据集中频率最高的值。R没有一个标准的内置函数来计算模式。
例子
# Create the data
A <- c(17, 12, 8, 53, 1, 12,
       43, 17, 43, 10)

print(mean(A))
print(median(A))

mode <- function(x) {
   a <- unique(x)
   a[which.max(tabulate(match(x, a)))]
}

# Calculate the mode using
# the user function.
print(mode(A)
输出
[1] 21.6
[1] 14.5
[1] 17
正态分布
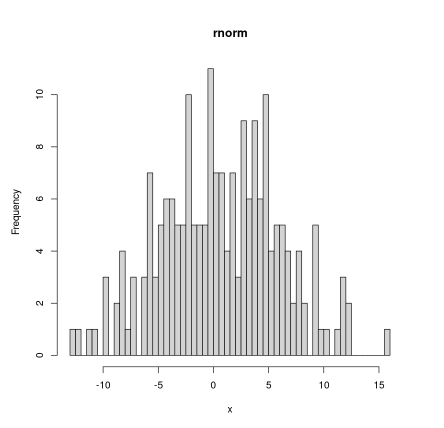
正态分布讲述的是数据值是如何分布的。例如,人口的身高、鞋码、智商水平、掷骰子等等。在R语言中,有4个内置函数可以生成正态分布:
- R编程中的 dnorm() 函数测量分布的密度函数。
dnorm(x, mean, sd)
- pnorm() 函数是累积分布函数,用于测量随机数X取值小于或等于x的概率。
pnorm(x, mean, sd)
- qnorm() 函数是 pnorm() 函数的逆函数。它接收概率值并给出与概率值相对应的输出。
qnorm(p, mean, sd)
- R编程中的 rnorm() 函数被用来生成一个正态分布的随机数向量。
rnorm(n, mean, sd)
例子
# creating a sequence of values
# between -10 to 10 with a
# difference of 0.1
x <- seq(-10, 10, by=0.1)


y = dnorm(x, mean(x), sd(x))
plot(x, y, main='dnorm')

y <- pnorm(x, mean(x), sd(x))
plot(x, y, main='pnorm')

y <- qnorm(x, mean(x), sd(x))
plot(x, y, main='qnorm')

x <- rnorm(x, mean(x), sd(x))
hist(x, breaks=50, main='rnorm')
输出
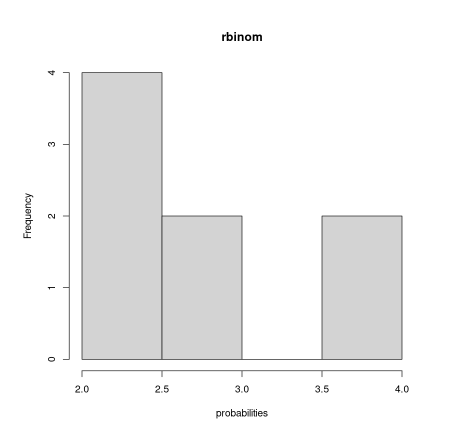
R语言 二项分布
二项分布是一种离散分布,只有两种结果,即成功或失败。例如,确定某张彩票是否中奖,某种药物是否能够治愈一个人,它可以用来确定在有限次数的抛掷中的头数或尾数,用于分析模具的结果,等等。我们有四个函数用于处理R中的二项分布,即。
- dbinom()
dbinom(k, n, p)
- pbinom( )
pbinom(k, n, p)
其中n是总的试验次数,p是成功的概率,k是必须找出概率的值。
- qbinom( )
qbinom(P, n, p)
其中P是概率,n是试验的总数,p是成功的概率。
- rbinom( )
rbinom(n, N, p)
其中n是观察数,N是试验的总数,p是成功的概率。
例子
probabilities <- dbinom(x = c(0:10), size = 10, prob = 1 / 6)
plot(0:10, probabilities, type = "l", main='dbinom')

probabilities <- pbinom(0:10, size = 10, prob = 1 / 6)
plot(0:10, , type = "l", main='pbinom')

x <- seq(0, 1, by = 0.1)
y <- qbinom(x, size = 13, prob = 1 / 6)
plot(x, y, type = 'l')

probabilities <- rbinom(8, size = 13, prob = 1 / 6)
hist(probabilities)
输出
时间序列分析
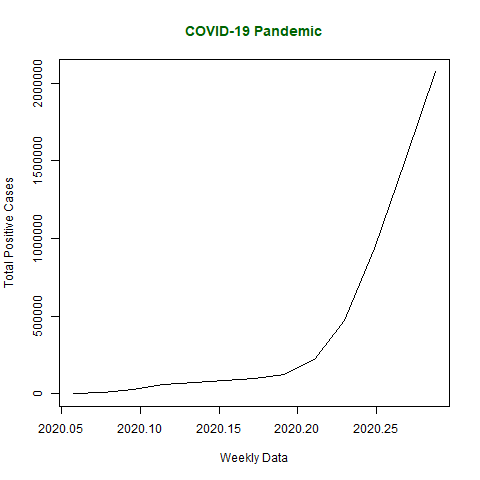
R中的时间序列是用来查看一个对象在一段时间内的行为方式。在R中,可以通过ts()函数轻松完成。
例子: 让我们以COVID-19大流行的情况为例。将2020年1月22日至2020年4月15日每周的世界COVID-19病例的阳性总数作为数据向量。
# Weekly data of COVID-19 positive cases from
# 22 January, 2020 to 15 April, 2020
x <- c(580, 7813, 28266, 59287, 75700,
    87820, 95314, 126214, 218843, 471497,
    936851, 1508725, 2072113)

# library required for decimal_date() function
library(lubridate)

# creating time series object
# from date 22 January, 2020
mts <- ts(x, start = decimal_date(ymd("2020-01-22")),
                            frequency = 365.25 / 7)

# plotting the graph
plot(mts, xlab ="Weekly Data",
        ylab ="Total Positive Cases",
        main ="COVID-19 Pandemic",
        col.main ="darkgreen")
输出
 极客教程
极客教程