R语言 geomtextpath包给线图加标签
在这篇文章中,我们将看到如何使用R编程语言中的geomtextpath包在线图上直接加标签。
Geomtextpath 是用来定制标签的,使用geomtextpath图形文本遵循任何路径,它将保持正确的间距和角度,即使你改变你的绘图设备的大小和长宽比。
安装
要安装这个软件包,请在终端键入以下命令。
install.packages("remotes")
remotes::install_github("AllanCameron/geomtextpath")
方法1:使用geom_textline()方法
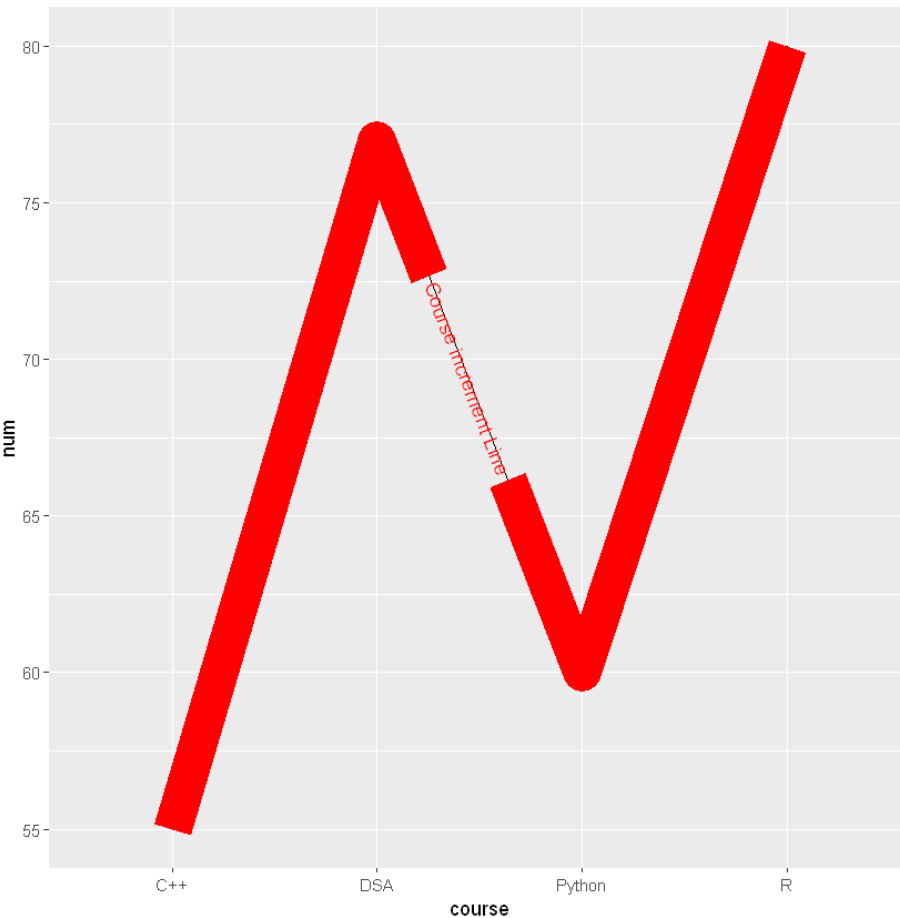
在这里,我们正在创建一个数据框架,并使用ggplot2绘制一个线图,然后使用geomtextpath中的geom_textline()方法。
library(ggplot2)
library(geomtextpath)

# Create data for chart
val <-data.frame(course=c('DSA','C++','R','Python'),
                num=c(77,55,80,60))

# Basic Line
ggplot(data=val, aes(x=course, y=num, group=1)) +
geom_line()+
geom_textline(label = "Course increment Line",
                color = "Red",
                linewidth=10)
geom_point()
方法2: 使用geom_density()方法
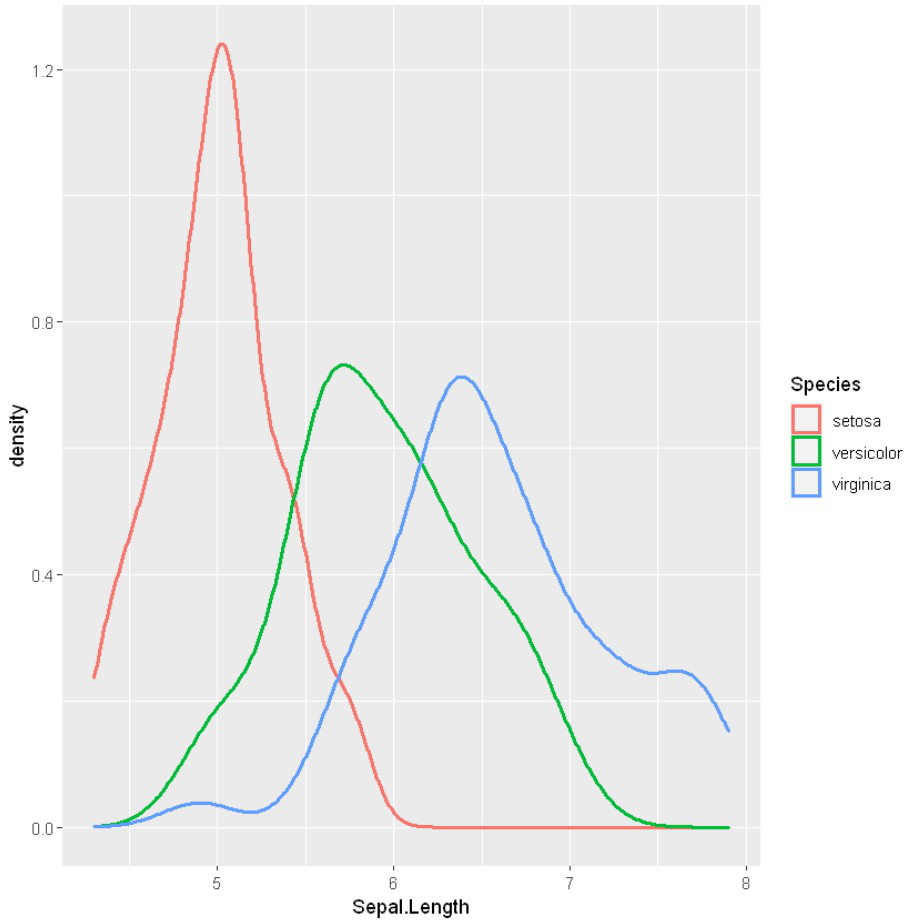
geom_density()也是用来添加新标签的,首先,我们将创建密度线,然后应用 geom_density。
library("ggplot2")

ggplot(iris, aes(Sepal.Length, colour = Species)) +
geom_density(size=1)
输出
方法3:使用geomtextdensity()方法
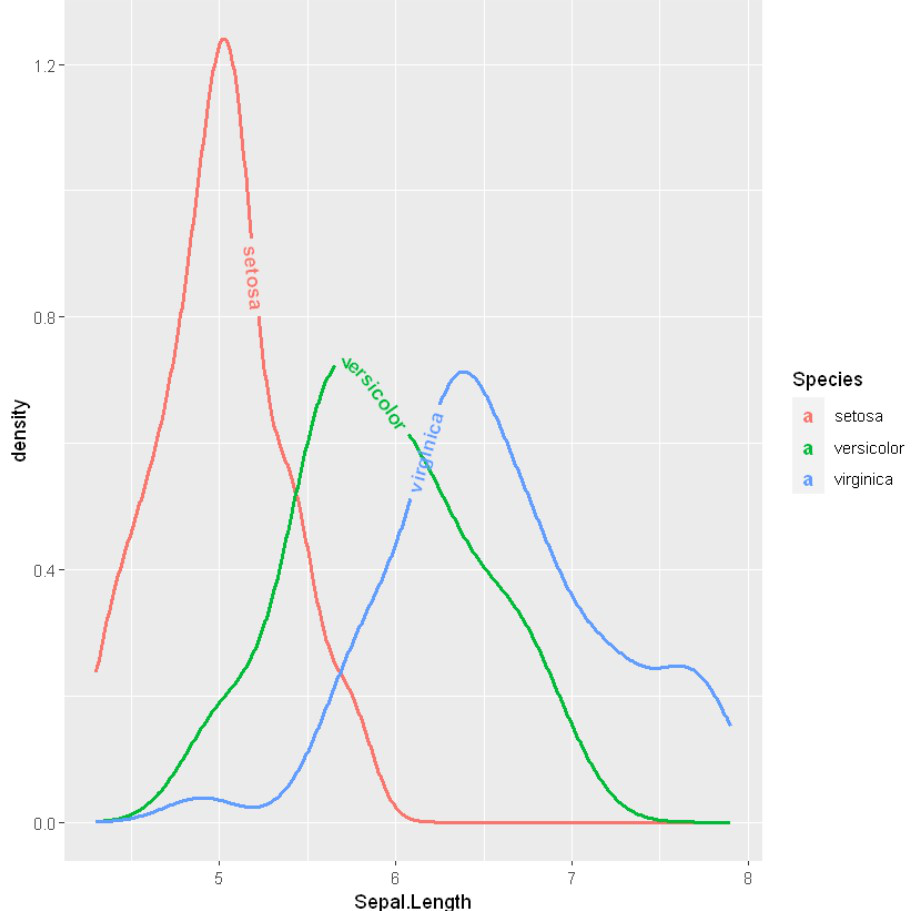
这里我们使用虹膜数据集来创建密度线,然后我们将使用geomtextpath的geomtextdensity()方法。
library("ggplot2")
library(geomtextpath)

ggplot(iris, aes(Sepal.Length, colour = Species, label = Species)) +
geom_textdensity(fontface = 2,
                   linewidth=1)
输出
 极客教程
极客教程

