R语言 如何向由ggplotly创建的plotly对象添加trace?
在R语言中向plotly对象添加轨迹的概念是基于将数据分层以创建一个更复杂和更有信息量的图表的想法。plotly中的trace是一个数据层,被绘制在图表上。每条轨迹都有自己的数据和视觉属性,比如绘图的类型,标记的颜色和大小,以及线条的风格。
要向一个plotly对象添加跟踪,你可以使用add_trace函数。该函数将你想添加跟踪的plotly对象,以及跟踪的数据和视觉属性作为输入。你可以用x和y参数来指定跟踪的数据,你可以用type参数来指定绘图的类型。例如,你可以使用type = “scatter “来创建一个散点图,或者type = “bar “来创建一个柱状图。
语法
plotly_obj <- add_trace(plotly_obj, x = mtcarswt, y = mtcarsqsec,
type = "scatter", mode = "markers", name = "qsec",
color = "red", marker = list(size = 10), legendgroup = "Group 1" )
其中
- p: 一个plotly对象,追踪应被添加到其中。
- x: 一个数字向量或时间序列,包含数据点的X坐标。
- y :一个数字向量,包含数据点的Y坐标。
- type :一个字符串,指定要添加的跟踪类型。可能的值包括 “散点图”、”条形图”、”柱状图”、”盒状图”、”饼状图 “以及其他许多类型。
- mode : 一个字符串,指定跟踪的显示模式。例如,”lines “将用线条连接数据点,而 “markers “将以标记的形式显示单个数据点。
- name(名称 ):一个字符串,用于给轨迹命名,将在图例中显示。
- color(颜色 ):字符串或数字矢量,用于指定跟踪所使用的颜色。
- marker(标记 ):用于自定义轨迹中标记的外观的选项列表。
- line : 用于自定义轨迹中的线条外观的选项列表。
- legendgroup : 一个字符串,用于指定图例中的轨迹所属组别。具有相同legendgroup值的轨迹将在图例中被归为一组。
你还可以使用add_trace函数的各种参数来定制跟踪的外观。例如,你可以使用标记参数来指定标记的颜色和大小,或者使用线条参数来指定线条的样式。您还可以使用文本位置参数来指定文本标签在绘图上的位置。
通过向一个plotly对象添加多条轨迹,您可以创建更复杂、更丰富的图,在同一个图上显示多组数据。当你想比较不同的数据集或突出不同变量之间的关系时,这可能特别有用。
安装所需的软件包并使用库函数加载它们。
install.packages("plotly")
install.packages("ggplot2")
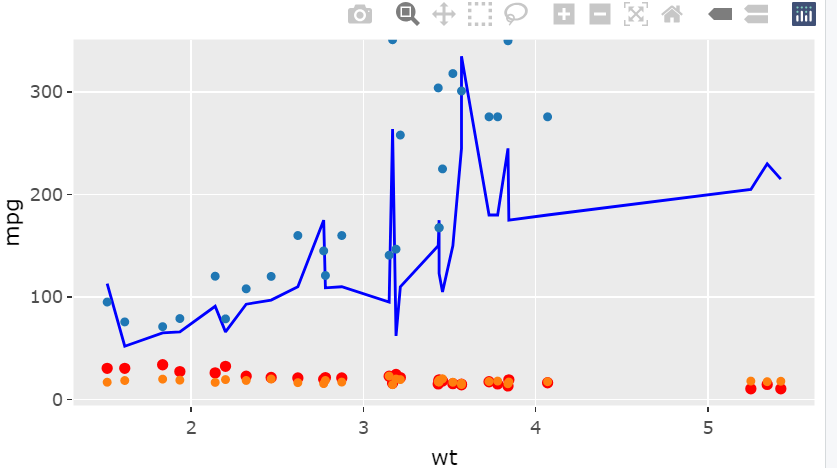
使用ggplot函数创建一个ggplot对象。指定数据和绘图的X和Y美学。使用ggplotly函数将ggplot对象转换为plotly对象。使用add_trace函数向plotly对象添加额外的轨迹。用x和y参数指定每个轨迹的数据,用type参数指定绘图的类型。使用add_trace函数的任何相关参数(例如,标记、线、文本位置)自定义每个轨迹的外观。使用 plotly_obj 命令显示 plotly 对象。
# Load the necessary libraries
library(plotly)
library(ggplot2)

# Create a ggplot object with two layers
p <- ggplot(data = mtcars, aes(x = wt,
                               y = mpg)) +
  geom_point(color = "red") +
  geom_line(aes(y = hp), color = "blue")

# Convert the ggplot object to a plotly object
plotly_obj <- ggplotly(p)

# Add two additional traces to the plotly object
plotly_obj <- add_trace(plotly_obj,
                        x = mtcarswt,
                        y = mtcarsdisp,
                        type = "scatter",
                        mode = "markers",
                        name = "disp")
plotly_obj <- add_trace(plotly_obj,
                        x = mtcarswt,
                        y = mtcarsqsec,
                        type = "scatter",
                        mode = "markers",
                        name = "qsec")

# Display the plotly object
plotly_obj
输出

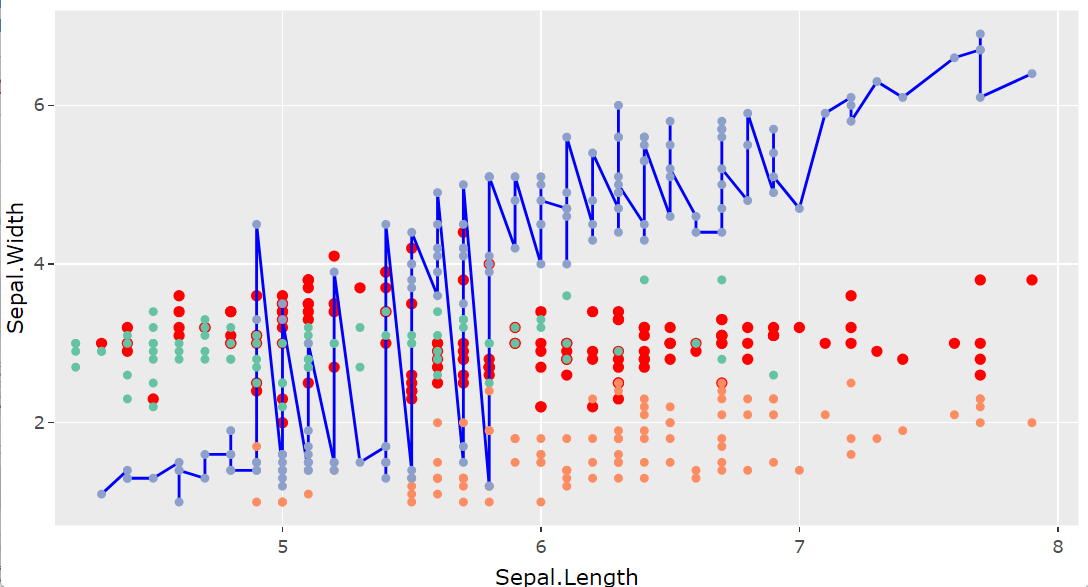
这段代码使用ggplot创建了一个带有单层的plotly对象,然后使用add_trace添加了三个附加层。每一个额外的图层都使用了不同的美学和几何组合,结果是一个总共有四层的图。
# Load the necessary libraries
library(plotly)
library(ggplot2)

# Create a ggplot object with a single layer
p <- ggplot(data = iris, aes(x = Sepal.Length,
                             y = Sepal.Width)) +
  geom_point(color = "red") +
  geom_line(aes(y = Petal.Length), color = "blue")

# Convert the ggplot object to a plotly object
plotly_obj <- ggplotly(p)

# Add three additional traces to the plotly
# object, using different aesthetics and geoms
plotly_obj <- add_trace(plotly_obj,
                        x = irisPetal.Length,
                        y = irisSepal.Width,
                        type = "scatter",
                        mode = "markers",
                        name = "Petal.Length",
                        color = "blue")
plotly_obj <- add_trace(plotly_obj,
                        x = irisSepal.Length,
                        y = irisPetal.Width,
                        type = "scatter",
                        mode = "markers",
                        name = "Petal.Width",
                        color = "green")
plotly_obj <- add_trace(plotly_obj,
                        x = irisSepal.Length,
                        y = irisPetal.Length,
                        type = "scatter",
                        mode = "markers",
                        name = "Petal.Length",
                        color = "orange")

# Display the plotly object
plotly_obj
输出

 极客教程
极客教程