R语言 ggthemes包
R是一种编程语言,用于执行统计计算和图形化目的。它目前得到了R核心团队和R统计计算基金会的支持和扶持。对于数据分析和统计软件的创建,R被统计学家、生物信息学家和数据挖掘者所使用。编程语言R是数据挖掘中最受欢迎的语言之一。 在这篇文章中,我们将讨论R编程语言中的ggthemes包。
ggthemes包为用户提供了修改图表的能力。它为ggplots包提供了额外的主题、标度和地理坐标。让我们从安装ggthemes包开始。要做到这一点,请使用以下命令。
install.packages('ggthemes')
在下面的所有例子中,我们将使用MTCars数据集。
ggthemes包中的重要函数
theme_base(): 它是一个类似于R图形基础主题的主题。
语法: theme_base(base_size = 16, base_family = “”)
参数
- base_size: 字体大小。
- base_family: 字体家族。
例子
library(ggplot2)
library(ggthemes)

p <- ggplot(mtcars) + geom_point(aes(x = wt,
                                     y = mpg,
                                     colour = factor(gear)))
q <- p + theme_base() + ggtitle("theme_base()")
png(filename = "image1.png")
plot(q)
输出
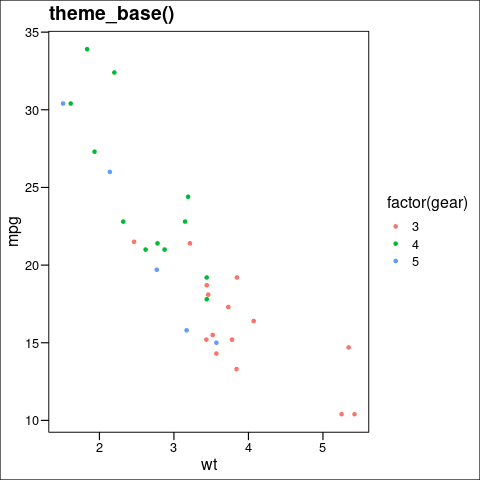
ggthemes中的theme_base主题
theme_calc(): 它是一个类似于LibreOffice Calc图表默认设置的主题。
语法: theme_calc(base_size = 10, base_family = “sans”)
参数
- base_size : 字体大小。
- base_family : 字体家族。
例子
library(ggplot2)
library(ggthemes)

p <- ggplot(mtcars) + geom_point(aes(x = wt,
                                    y = mpg,
                                    colour = factor(gear)))
q <- p + theme_calc() + ggtitle("theme_calc()")
png(filename = "image2.png")
plot(q)
输出
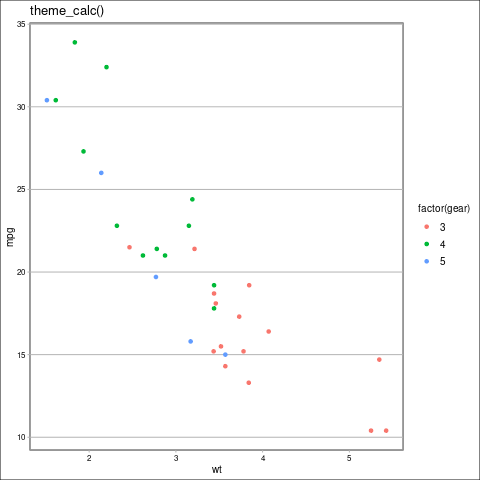
ggthemes中的theme_calc主题
theme_economist(): 它是一个试图接近《经济学家》主题的主题。
语法: theme_economist(base_size = 10, base_family = “sans”, horizontal = TRUE, dkpanel = FALSE)
参数
- base_size: 字体大小。
- base_family: 字体家族。
- horizontal: 是一个布尔值,指定是否应该有水平线。
- dkpanel: 它是逻辑性的,指定是否需要一个黑暗的面板。
例子
library(ggplot2)
library(ggthemes)

p <- ggplot(mtcars) + geom_point(aes(x = wt,
                                     y = mpg,
                                     colour = factor(gear)))
q <- p + theme_economist() + ggtitle("theme_economist()")
png(filename = "image3.png")
plot(q)
输出
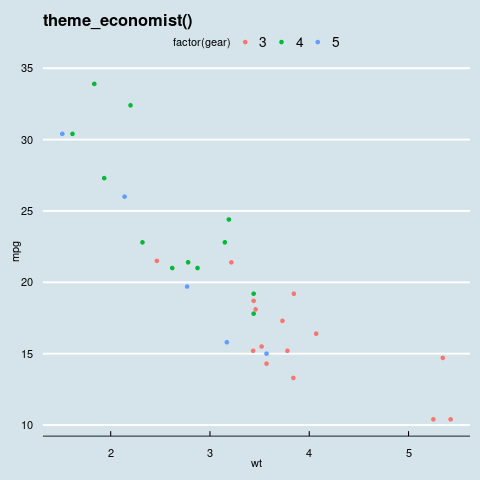
ggthemes中的theme_economist主题
theme_gdocs(): 它是一个类似于Google Docs默认外观的主题。
语法: theme_gdocs(base_size = 12, base_family = “sans”)
参数
- base_size: 字体大小。
- base_family: 字体家族。
例子
library(ggplot2)
library(ggthemes)

p <- ggplot(mtcars) + geom_point(aes(x = wt,
                                     y = mpg,
                                     colour = factor(gear)))
q <- p + theme_gdocs() + ggtitle("theme_gdocs()")
png(filename = "image4.png")
plot(q)
输出
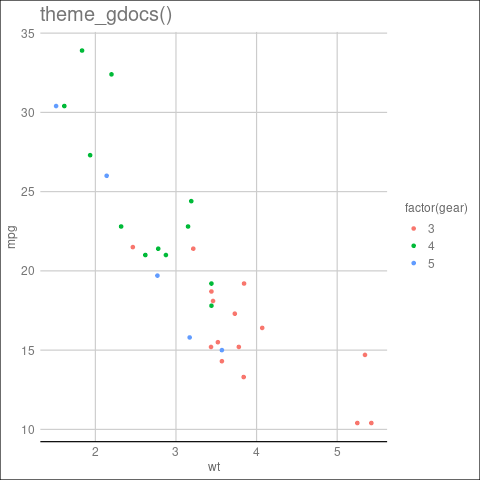
ggthemes中的theme_gdocs主题
theme_wsj(): 这是一个试图接近《华尔街日报》主题的主题。
语法: theme_wsj(base_size = 12, color = “brown”, base_family = “sans”, title_family = “mono”)
参数
- base_size: 字体大小。
- color: 绘图的背景颜色。
- base_family: 字体家族。
- title_family : 标题的字体家族。
例子
library(ggplot2)
library(ggthemes)

p <- ggplot(mtcars) + geom_point(aes(x = wt,
                                     y = mpg,
                                     colour = factor(gear)))
q <- p + theme_wsj() + ggtitle("theme_wsj()")
png(filename="image5.png")
plot(q)
输出
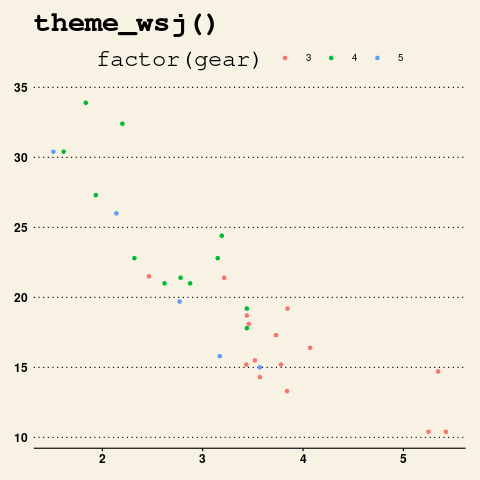
ggthemes中的theme_wsj主题
scale_colour_calc(): 它是LibreOffice的色标。
语法: scale_colour_calc(…)
参数: 它接收一个带有下列选项的选项对象。
- palette: 这是一个调色板函数。
- breaks: 用于色标的休息时间。
- limits : 这是一个参数,用来指定比例尺的可能值和它们的顺序。
- drop: 它是一个布尔值,用于指定是否省略未使用的因子水平。
- na.translate: 这是一个参数,用户可以用它来删除离散比例尺中的缺失值。
- scale_name: 它是错误信息中应该使用的比例尺的名称。
- name: 是比例尺的名称。
- labels : 刻度表要使用的标签。
- expand: 是用于指定扩展常数的参数。
- guide : 该参数用于为刻度尺创建一个指南。
- position: 是轴的位置。
- super: 是用于构建的刻度尺的父类或超类。
例子
library(ggplot2)
library(ggthemes)

p <- ggplot(mtcars) + geom_point(aes(x = wt,
                                     y = mpg,
                                     colour = factor(gear)))
q <- p + scale_colour_calc() +
ggtitle("scale_colour_calc()")
png(filename="image6.png")
plot(q)
输出
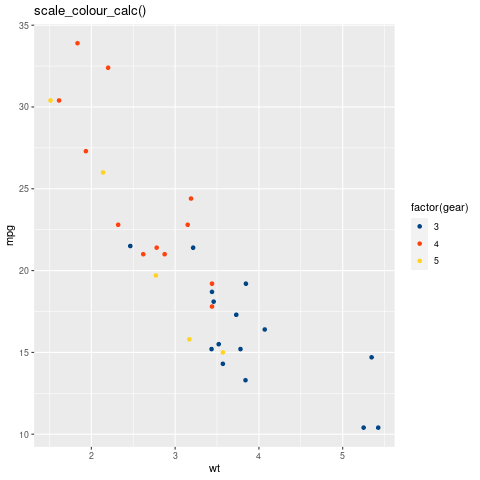
scale_color_calc在ggthemes中的比例。
scale_colour_economist(): 它是使用《经济学家》中的颜色的色标。
语法: scale_colour_economist(…)
参数: 它接收一个带有下列选项的选项对象。
- palette: 这是一个调色板函数。
- breaks: 色标要使用的断点。
- limits : 这是一个参数,用来指定色阶的可能值和它们的顺序。
- drop: 它是一个布尔值,用于指定是否省略未使用的因子水平。
- na.translate: 这是一个参数,用户可以用它来删除离散比例尺中的缺失值。
- scale_name: 它是错误信息中应该使用的比例尺的名称。
- name: 是比例尺的名称。
- labels : 刻度表要使用的标签。
- expand: 是用于指定扩展常数的参数。
- guide : 该参数用于为刻度尺创建一个指南。
- position: 是轴的位置。
- super: 是用于构建的刻度尺的父类或超类。
例子
library(ggplot2)
library(ggthemes)

p <- ggplot(mtcars) + geom_point(aes(x = wt,
                                    y = mpg,
                                    colour = factor(gear)))
q <- p + scale_colour_economist() +
     ggtitle("scale_colour_economist()")
png(filename = "image7.png")
plot(q)
输出
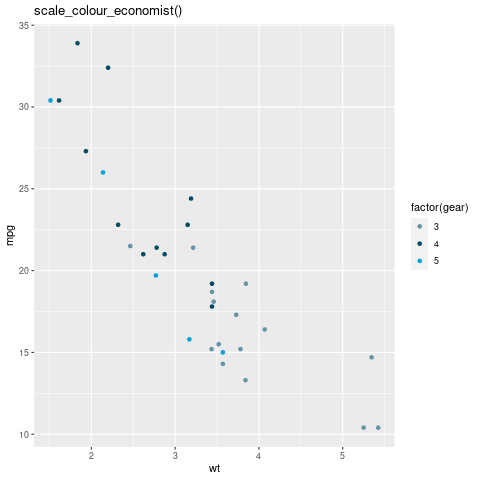
scale_color_economist scale in ggthemes
scale_colour_solarized(): 它是日晒的色标。
语法: scale_colour_solarized(accent,…)
参数
- accent: 起始颜色。
- option: 是指以下选项。
- palette: 这是调色板函数。
- breaks: 要用于色阶的断点。
- limits : 这是一个参数,用来指定色阶的可能值和它们的顺序。
- drop: 它是一个布尔值,用于指定是否省略未使用的因子水平。
- na.translate: 这是一个参数,用户可以用它来删除离散比例尺中的缺失值。
- scale_name: 它是错误信息中应该使用的比例尺的名称。
- name: 是比例尺的名称。
- labels : 刻度表要使用的标签。
- expand: 是用于指定扩展常数的参数。
- guide : 该参数用于为刻度尺创建一个指南。
- position: 是轴的位置。
- super: 是用于构建的刻度尺的父类或超类。
例子
library(ggplot2)
library(ggthemes)

p <- ggplot(mtcars) + geom_point(aes(x = wt,
                                    y = mpg,
                                    colour = factor(gear)))
q <- p + scale_colour_solarized() +
     ggtitle("scale_colour_solarized()")
png(filename = "image8.png")
plot(q)
输出
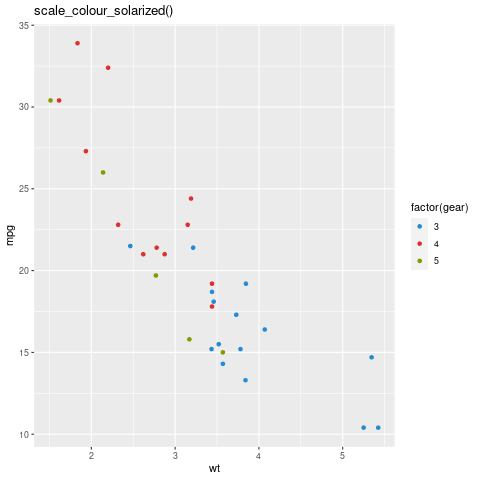
scale_color_solarized scale in ggthemes
 极客教程
极客教程