R语言 绘制特定点之间的线段 – segments() 函数
R语言中的 segment() 函数用于在特定的点之间绘制线段。
语法: segments(x0, y0, x1, y1)
参数:
x, y: 在所提供的点之间画一条线段的坐标。
返回: 给定点之间的线段
例1: 绘制一条线段
# Create empty example plot
plot(0, 0, col = "white", xlab = "", ylab = "")

# Draw one line
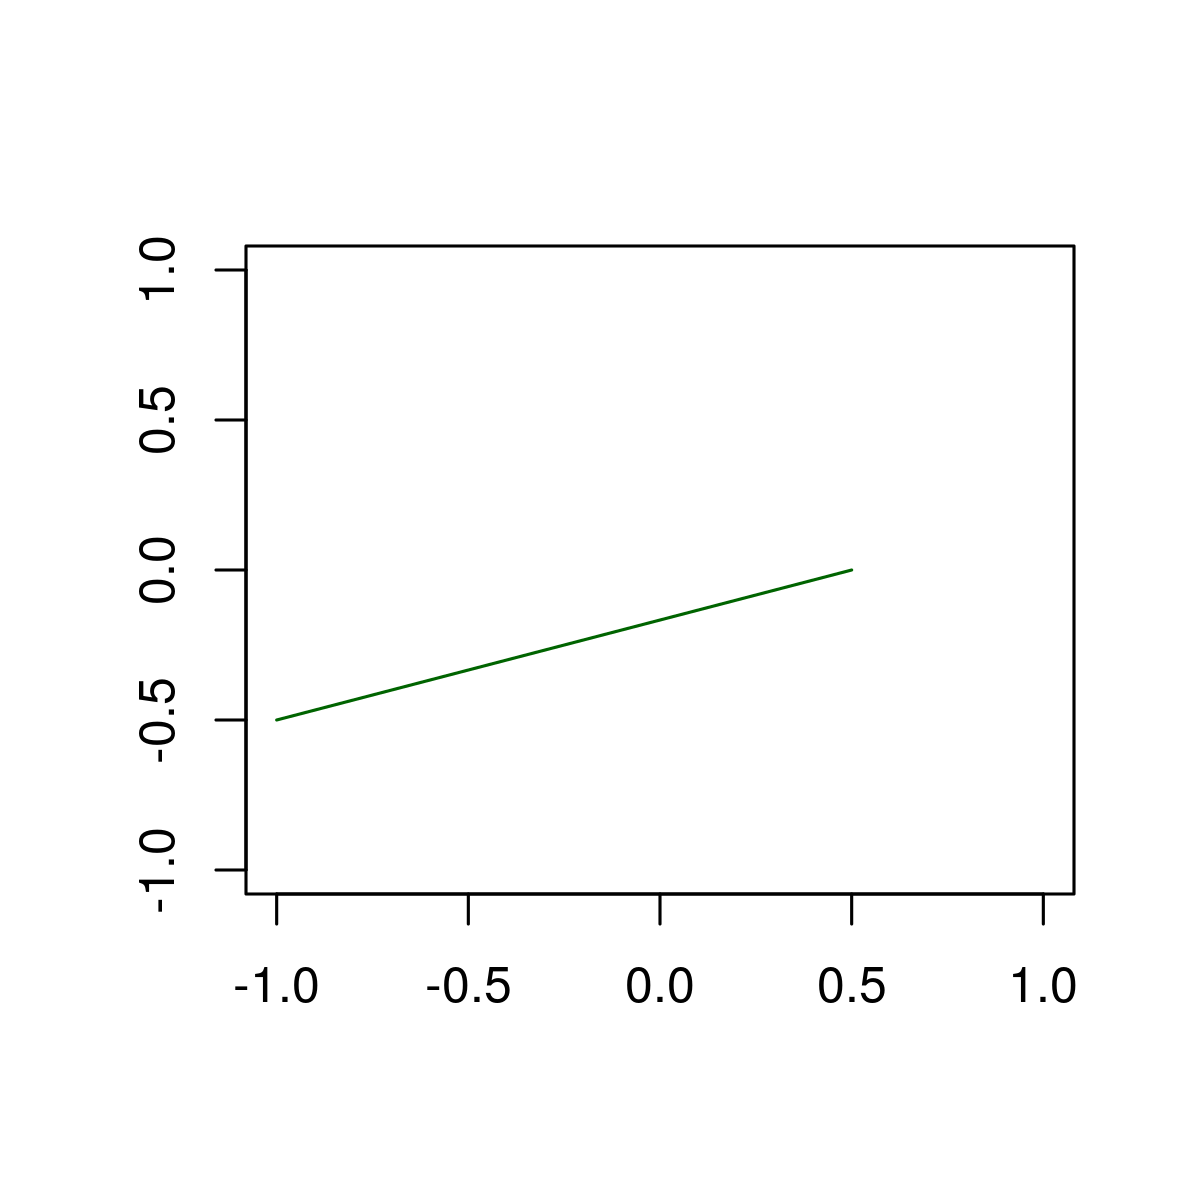
segments(x0 = - 1, y0 = - 0.5, x1 = 0.5, y1 = 0, col = "darkgreen")
输出:

这里,x0和y0是线段的起点,x1和y1是线段的终点。
例2: 修改颜色、厚度和线型
# Create empty example plot
plot(0, 0, col = "white", xlab = "", ylab = "")

# Draw one line as in Example 1
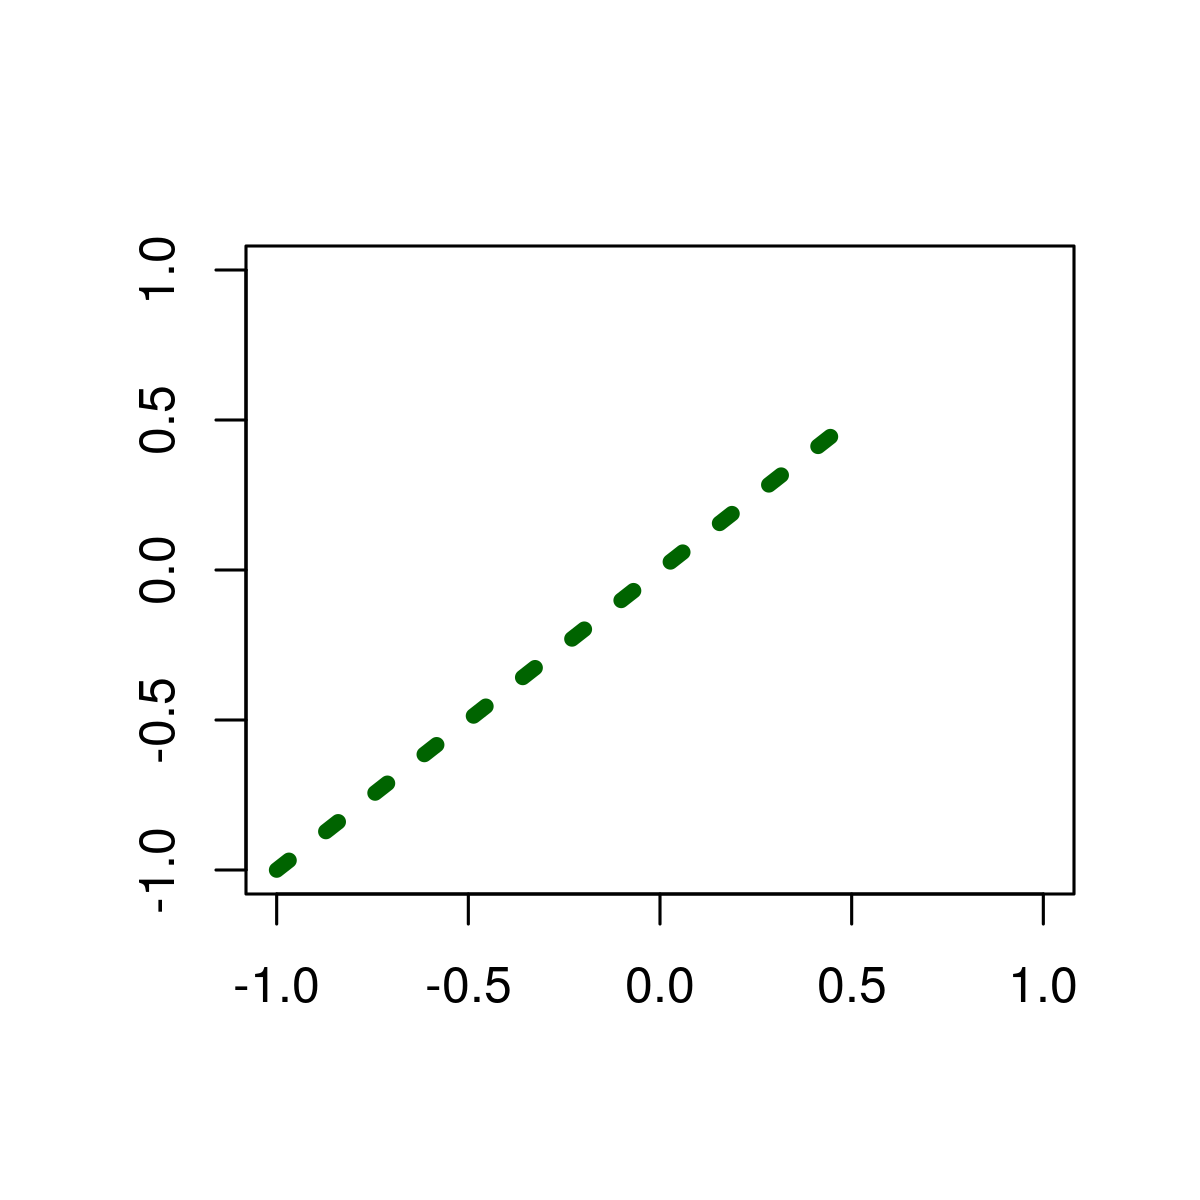
segments(x0 = - 1, y0 = - 1, x1 = 0.5, y1 = 0.5,

         # Color of line
         col = "darkgreen",

         # Thickness of line
         lwd = 5,

         # Line type
         lty = "dotted")
输出:

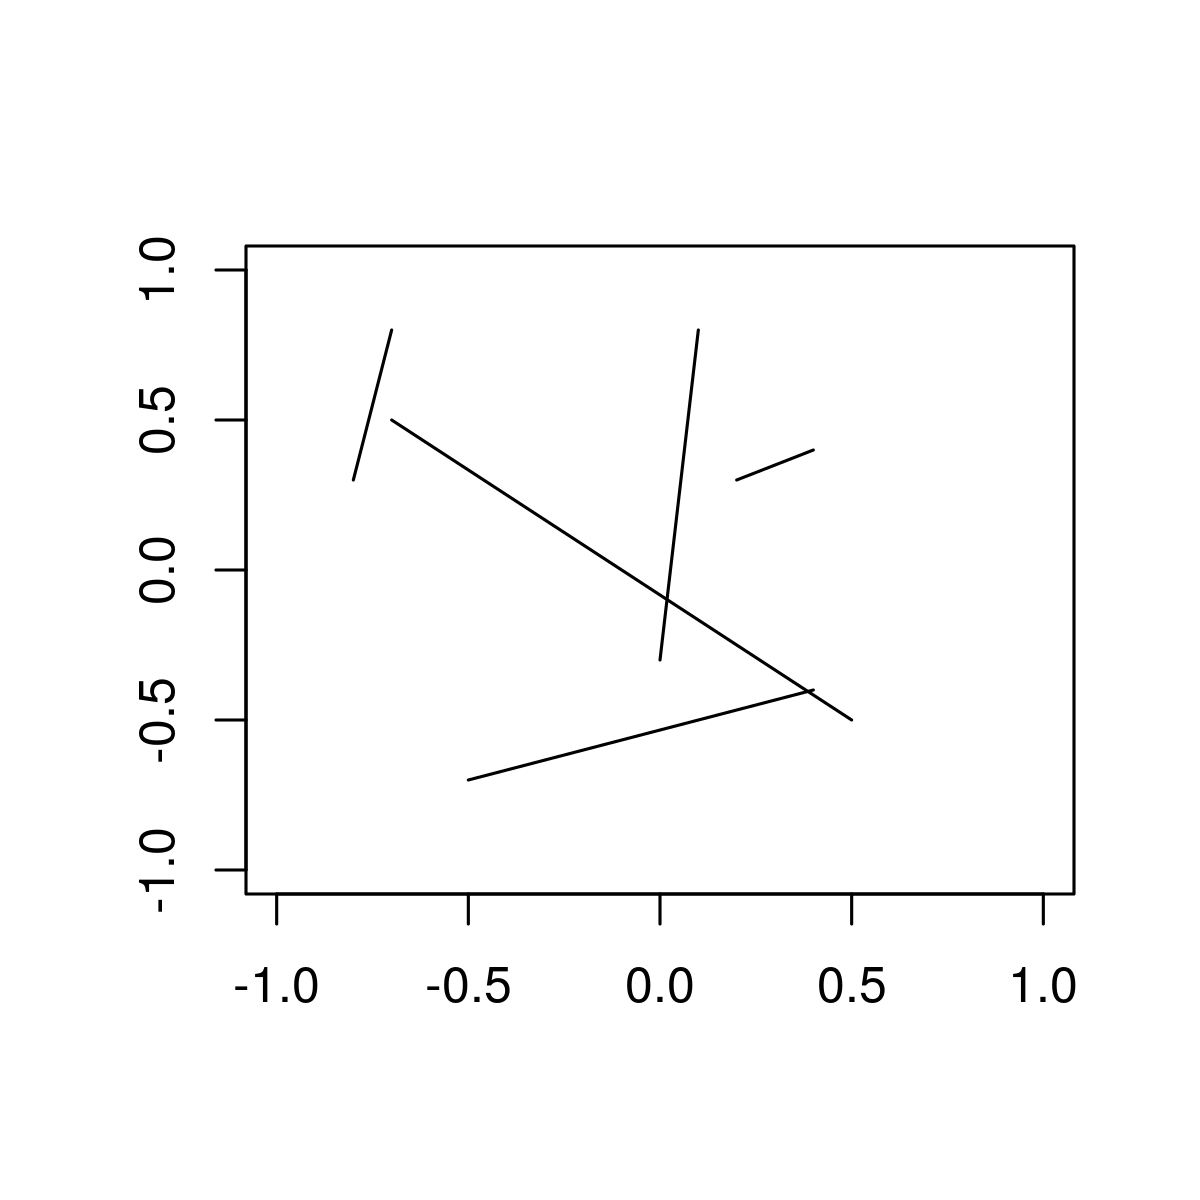
例3: 绘制多条线段到R图。
# Create empty example plot
plot(0, 0, col = "white", xlab = "", ylab = "")

# Create data frame with line-values
multiple_segments <- data.frame(x0 = c(0.1, 0.2, - 0.7, 0.4, - 0.8),
                       y0 = c(0.8, 0.3, 0.5, - 0.4, 0.3),
                       x1 = c(0, 0.4, 0.5, - 0.5, - 0.7),
                       y1 = c(- 0.3, 0.4, - 0.5, - 0.7, 0.8))

 # Draw multiple lines
 segments(x0 = multiple_segmentsx0,
         y0 = multiple_segmentsy0,
         x1 = multiple_segmentsx1,
         y1 = multiple_segmentsy1)
输出:

 极客教程
极客教程