R语言 使用ggdark为可视化提供黑暗模式
作为一个开发者,黑暗模式是大多数人最喜欢的选项之一。有些人认为这对眼睛有好处,有些人则是出于外观上的考虑。因此,在这篇文章中,我们要看看R编程语言中的这样一个包,它使我们能够在我们的可视化中引入不同的黑暗主题。
ggdark是一个建立在ggplot2上的包,用于生成基于黑暗主题的图。ggdark包包括 dark_mode() , dark_theme_minimal() ,以及其他函数。通过应用这些函数,图的颜色被颠倒过来,以确保图的可见性。安装并加载所需的包。
# Install required package
install.packages("ggplot2")
install.packages("ggdark")

# Load the installed packages
library(ggplot2)
library(ggdark)
dark_mode(): 用于激活’ggplot2’主题上的黑暗模式。
语法
dark_mode(.theme = theme_get(), verbose = TRUE, force_geom_invert = FALSE)
其中
- .theme – ggplot2主题对象
- verbose – 打印信息(默认:TRUE
- force_geom_invert – 强制反转geom默认的填充和颜色/色彩(默认:FALSE)
data(iris)
# Plotting the density plot

ggplot2::ggplot(iris, aes(x = Sepal.Width, fill = Species)) +
  geom_density(alpha = 0.7) +
  ggdark::dark_mode() +
  theme(legend.position = "bottom")
输出

用dark_mode()绘制图表
dark_theme_gray(): 这是来自’ggplot2’的完整主题的黑暗版本之一,用于控制所有非数据显示。
语法
dark_theme_gray(base_size, base_family, base_line_size, base_rect_size)
其中。
- base_size – 基本字体大小
- base_family – 基本字体系列
- base_line_size - 线条元素的基本尺寸
- base_rect_size - 矩形元素的基本尺寸
# load the default iris dataset
data(iris)

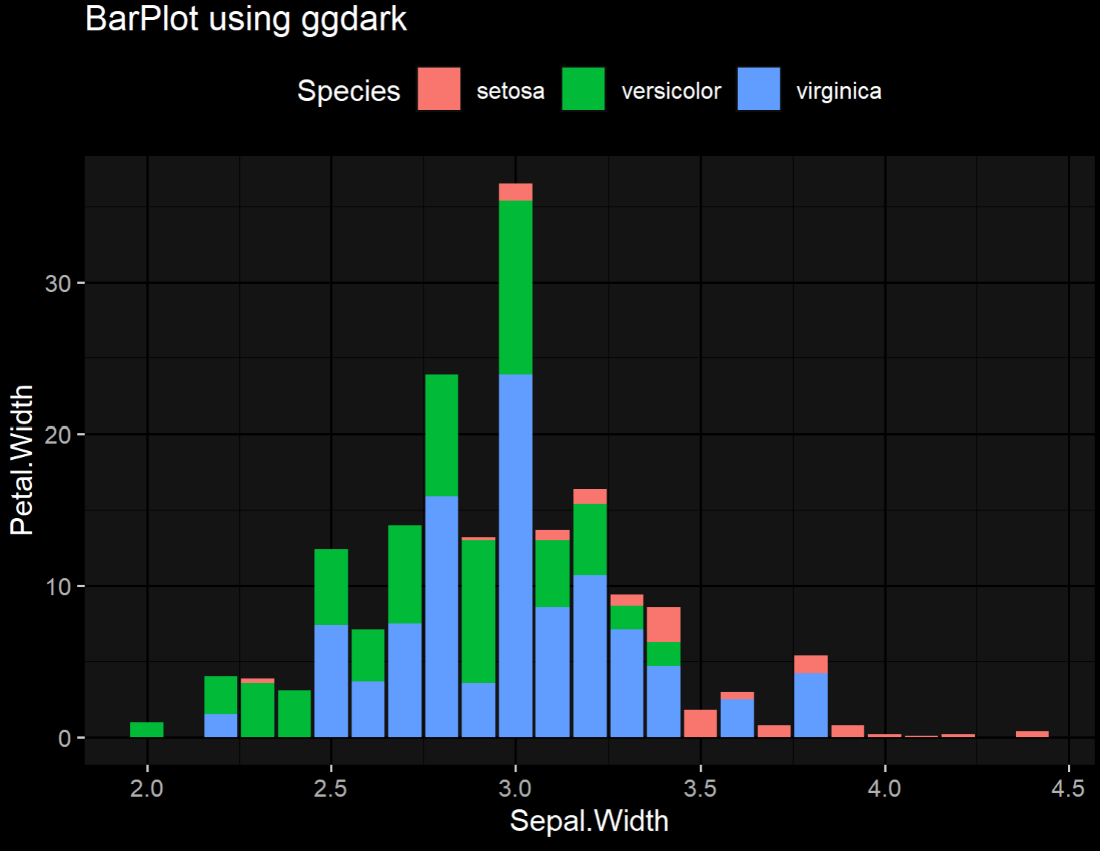
# Plotting the bar plot
ggplot2::ggplot(iris, aes(x = Sepal.Width,y=Petal.Width,
                          fill = Species)) +
  geom_bar(stat="identity") +
  ggdark::dark_theme_gray() +
  theme(legend.position = "top")+
  ggtitle("BarPlot using ggdark")
输出

用dark_theme_gray()绘制图表。
dark_theme_minimal(): 这是来自’ggplot2’的完整主题的黑暗版本之一,用于控制所有非数据显示。
语法
dark_theme_minimal(base_size, base_family, base_line_size, base_rect_size)
其中。
- base_size – 基本字体大小
- base_family – 基本字体系列
- base_line_size - 线条元素的基本尺寸
- base_rect_size - 矩形元素的基本尺寸
# load the default iris dataset
data(iris)

# Plotting the Points(Dot) Plot
ggplot2::ggplot(iris, aes(x = Sepal.Width,
                          y=Petal.Width,
                          color = Species)) +
  geom_point() +
  ggdark::dark_theme_minimal() +
  theme(legend.position = "right")+
  ggtitle("DotPlot using ggdark")
输出

用dark_theme_minimal()绘制图表。
 极客教程
极客教程