R语言 使用Shiny包创建一个交互式网络应用程序
在继续之前,也许快速介绍一下Shiny是什么会有帮助。由于Shiny包的存在,用R编程语言创建交互式网络应用程序非常简单。Shiny的优势在于,它使你能够将你的R代码扩展到网络上,这从本质上增加了你的代码对更多人的实用性。
由于R Shiny框架,即RStudio的一个软件包,用R构建交互式网络应用程序是非常简单的。R Shiny的奇妙之处在于,它能让你产生令人难以置信的有效数据报告和可视化,让用户探索一个数据集。除了Shiny元素外,你还可以使用HTML元素来设计你的应用程序的内容。
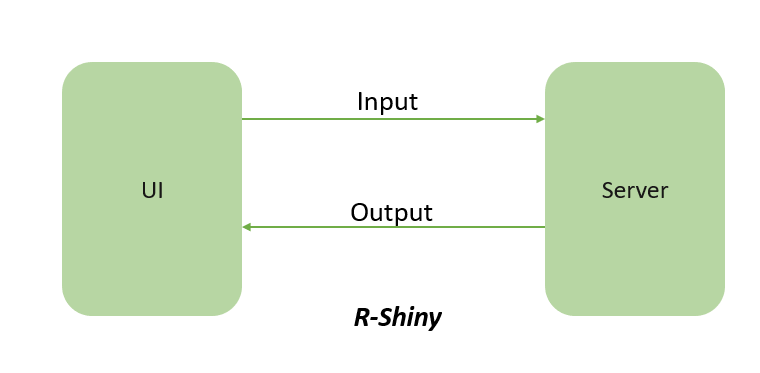
R-Shiny网络应用的构建模块
Shiny网络应用有两个部分。
- 用户界面 – {ui.R}UI控制应用程序页面上显示的内容以及组件的布局方式。这可能包括文本和其他标记元素、图形、接受用户输入的小工具,或绘图。在本教程中,你还将使用用户界面来定义一个带有多个标签的导航条。接收用户输入值的前端被称为 “用户界面”。
- 服务器– {server.R}是处理这些输入值的后端,以创建最终显示在网站上的输出结果。将通过用户界面显示的数据是在服务器的控制之下。你将把数据加载到服务器上并对其进行管理,然后使用来自用户界面的输入定义你的输出。

R-Shiny Web应用程序的构建模块
设置Shiny应用程序的步骤
- 创建一个新的目录,然后在其中创建两个R脚本,”ui.R “和 “server.R”,以创建一个新的Shiny应用程序。server.R “脚本将指定应用程序的逻辑和功能,而 “ui.R “脚本将指定应用程序的设计和用户接口。
- 使用 “ui.R “脚本的fluidPage()、sidebarLayout()和textInput()函数来设计应用程序的布局和用户界面。
- 使用observeEvent()和render*()等函数,在 “server.R “脚本中构建应用程序的逻辑和功能。
- 完成上述步骤后,你可以通过运行以下命令启动应用程序。
你需要安装Shiny , Shinythemes和ggplot2软件包,然后也要加载它们。
# Installing Necessary Packages
install.packages("shiny")
install.packages("shinythemes")
install.packages("ggplot2")

# Loading the libraries
library(shiny)
library(shinythemes)
library(ggplot2)
在加载库和模板后,你必须定义用户界面。
#UI Defined
ui <- fluidPage(theme = shinytheme("superhero"),
                navbarPage(

                      # mainPanel
                    "Welcome to GFG",

                      # Tab 1
                    tabPanel("Tab 1",
                             mainPanel(
                                 tags$h3("Register to GFG:"),
                                 textInput("txt1", "Name:", ""),
                                 textInput("txt2", "Surname:", ""),
                                  textInput("txt3", "Email:", ""),
                                  textInput("txt4", "Mobile.No:", ""),
                                 textInput("txt5", "Education:", ""),
                                 textInput("txt6", "College:", ""),
                                 textInput("txt7", "Programming Language:", ""),
                                 textInput("txt8", "Area of Intrest:", ""),

                                 hr(),
                                h4("Here is your Details"),
                               verbatimTextOutput("txtout"),
                             )),
                      # TabPanel
                    tabPanel("Tab 2",
                             h3("Hello !! Here is the Plot Graph,
                                 Slider, Dropdown and Date picker!!!"))),
                             hr(),
                             (
  plotOutput("plot") #PlotGraph
),
                             hr(),
                             sidebarPanel(
      sliderInput("slider", "Select a value:", min = 10,
                  max = 500, value = 125),
      selectInput("dropdown", "Select an option:",
                  c("Python", "JAVA", "C++")),
      dateInput("datepicker", "Select a date:"),
      ),#SidebarPanel
    mainPanel(
      h3("Selected values:"),
      textOutput("selected_value"),
      textOutput("selected_option"),
      textOutput("selected_date"),
    )
 )
在定义了用户界面之后,你必须定义服务器。在定义了用户界面和服务器后,你必须创建一个闪亮的对象。
# Define Server Function
server <- function(input, output) {
   outputselected_value <- renderText({inputslider})
  outputselected_option <- renderText({inputdropdown})
  outputselected_date <- renderText({inputdate})
   outputtxtout <- renderText({
     paste(inputtxt1, inputtxt2,
           inputtxt3, inputtxt4, inputtxt5,
           inputtxt6, inputtxt7, inputtxt8,
           sep = " " )
   })
    outputplot <- renderPlot({
    ggplot(mtcars, aes(x = wt, y = mpg)) + geom_point()
  })
 }


# to Run App
shinyApp(ui = ui, server = server)
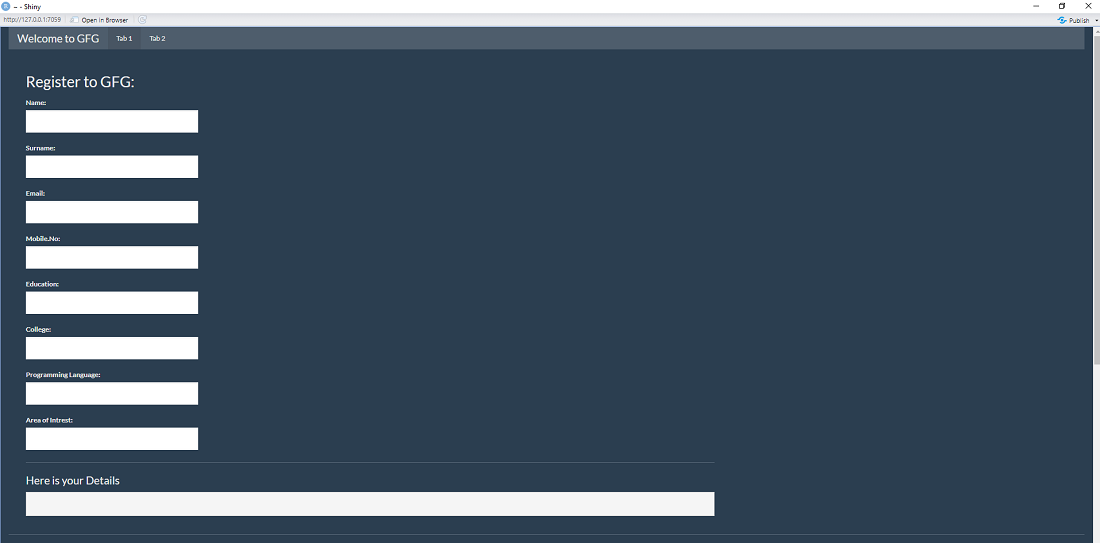
输出

闪亮的应用程序 – Tab 1

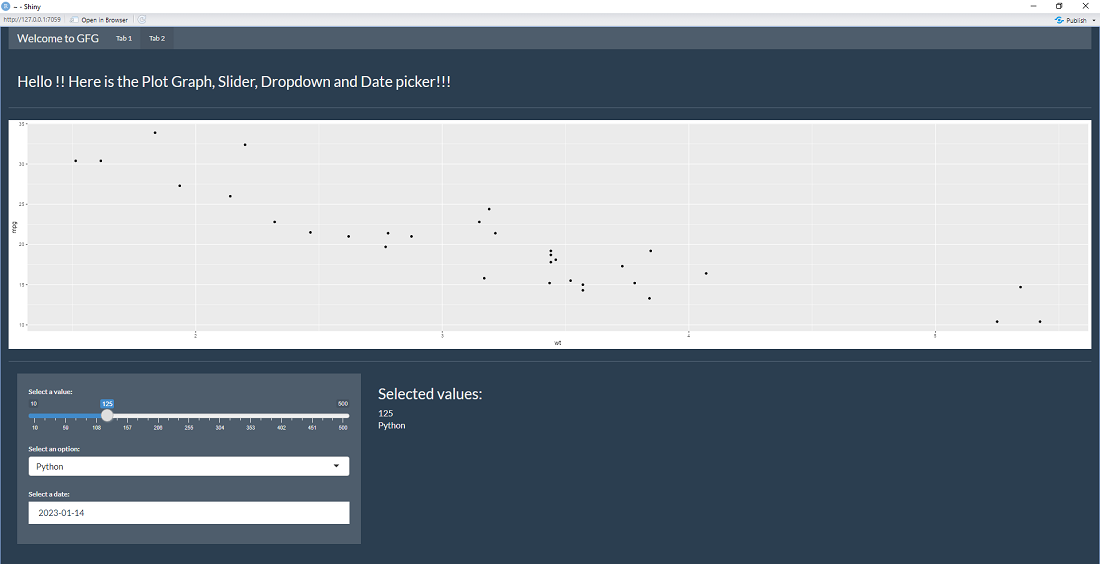
Shiny App – Tab 2
摘要
这个例子演示了如何使用Shiny包制作一个接受用户输入并显示结果的交互式Web应用。这个应用还展示了PlotGraph。在屏幕的左边,这个应用程序将显示一个滑块、下拉菜单和日期选择器。在屏幕的右边,它将显示被选中的数值。 为了创建一个更复杂的交互式用户界面和更复杂的服务器逻辑,你可以用更多的应用程序来使用其他各种Shiny函数和小工具。
 极客教程
极客教程