R语言 计算Logistic密度 – dlogis()函数
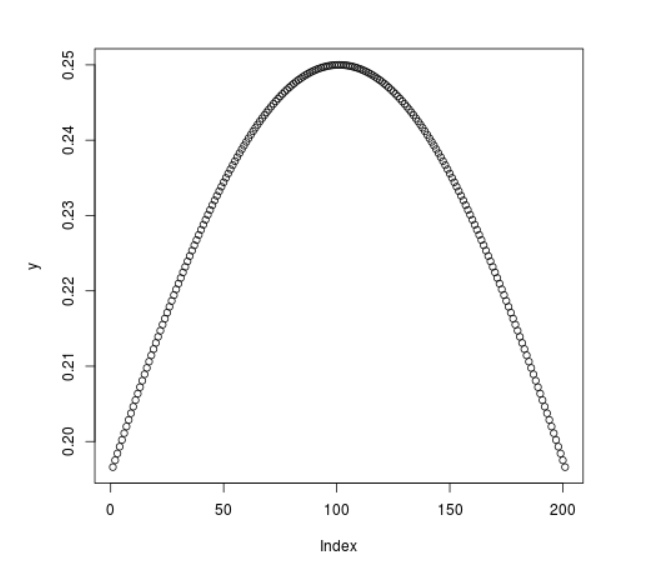
R语言中的 dlogis() 函数用于计算分布的logistic密度。它还可以创建逻辑分布的密度图。
语法: dlogis(vec)
参数:
vec: 密度的X值向量
例1 :
# R program to calculate
# logistic density

# Create a vector of x-values
x <- seq(-1, 1, by = 0.1)

# Calling the dlogis() function
y <- dlogis(x)
y
输出
 [1] 0.1966119 0.2055003 0.2139097 0.2217129 0.2287842 0.2350037 0.2402607
 [8] 0.2444583 0.2475166 0.2493760 0.2500000 0.2493760 0.2475166 0.2444583
[15] 0.2402607 0.2350037 0.2287842 0.2217129 0.2139097 0.2055003 0.1966119
例2 :
# R program to calculate
# logistic density

# Create a vector of x-values
x <- seq(-1, 1, by = 0.01)

# Calling the dlogis() function
y <- dlogis(x)

# Plot the graph
plot(y)
输出:

 极客教程
极客教程