R语言 改变ggplot2绘图的主题颜色
在这篇文章中,我们将学习如何在 R编程语言 中改变ggplot2图的主题颜色 。
ggplot2包
R语言中的ggplot2包可以用来实现数据的可视化。它可以用来绘制数据点。它提高了绘图数据的可读性。该软件包可以通过以下命令下载并安装到工作空间。
install.packages("ggplot2")
使用ggplot() 在R中改变ggplot2绘图的主题颜色
ggplot()方法可以用来创建一个数据点的图。这些点可以在ggplot()方法的审美映射中指定,其中x和y坐标代表要绘制的数据框架的列向量。
语法: ggplot(df, aes = )
参数 :
df - 要绘制的数据框。
aes - 美学映射。
使用 ggplot() 绘制图形
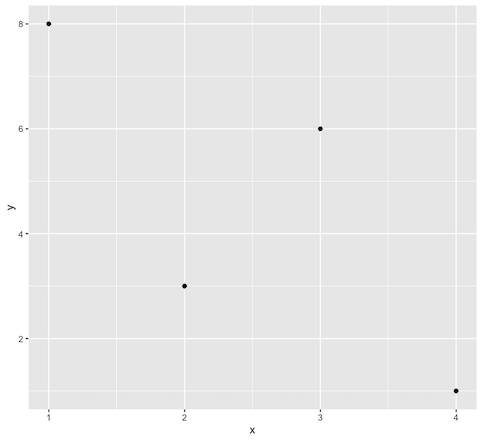
要绘制图表,首先我们必须使用data.frame()方法创建一个数据框,然后我们将该数据绘制成图表,并添加geom_point()组件,以便在图表中以点的形式表示数据值,如输出所示。
# Importing ggplot2 library
library(ggplot2)
# Creating a data frame
data_frame1 = data.frame(x= c(2,4,3,1),
                         y = c(3,1,6,8))
# Plotting the data
ggplot(data_frame1,aes(x = x , y =y)) +
  geom_point()
输出
根据背景板改变主题颜色
绘图的背景颜色可以通过使用主题函数来改变。它覆盖了默认的主题参数。背景主题可以通过以下语法来改变。
语法: theme( panel.background = element_rect(fill = , color = ))
参数
fill – 矩形的填充颜色
color – 边框颜色
size - 边框尺寸
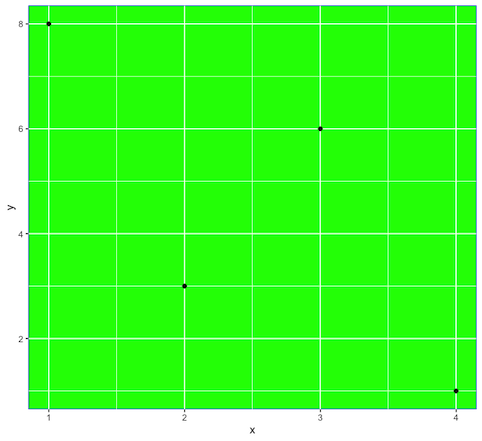
在这段代码中,我们将使用panal.background in theme()方法把背景颜色改为绿色,x轴和y轴的颜色改为蓝色。
# Importing ggplot2
library(ggplot2)
# Creating a data frame
data_frame1 = data.frame(x= c(2,4,3,1),
                         y = c(3,1,6,8))
# Plotting the data
ggplot(data_frame1,aes(x = x , y =y)) +
  geom_point()+
  theme(panel.background = element_rect(fill = 'green', color = 'blue'))
输出
根据内置的主题改变主题的颜色
ggplot中有大量的内建主题,可以作为组件添加到现有的绘图中。让我们来试试其中的一些。
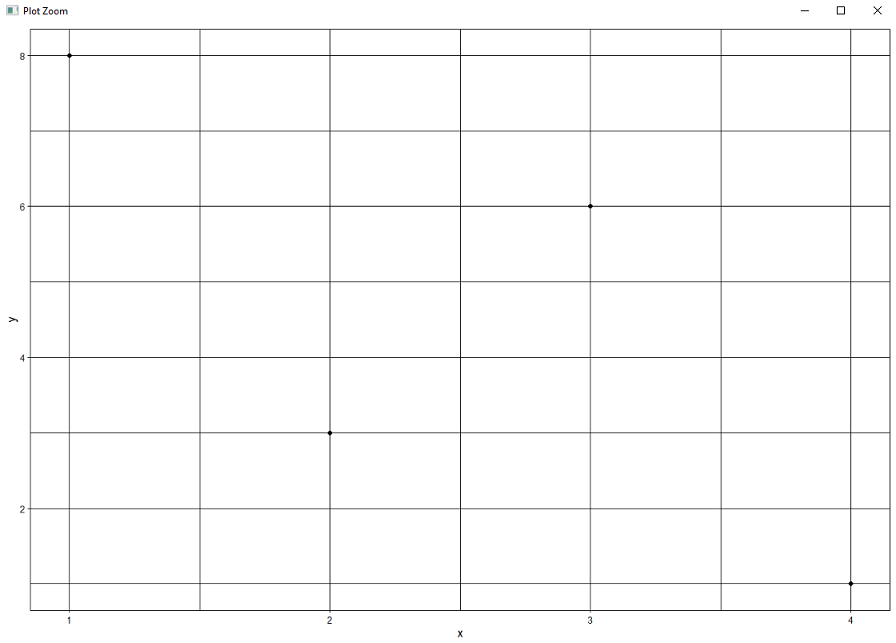
theme_linedraw(): 这个方法用于在图中创建黑线。
# Importing ggplot2
library(ggplot2)
# Creating a data frame
data_frame1 = data.frame(x= c(2,4,3,1),
                         y = c(3,1,6,8))
# Plotting the data
ggplot(data_frame1,aes(x = x , y =y)) +
  geom_point()+
  theme_linedraw()
输出
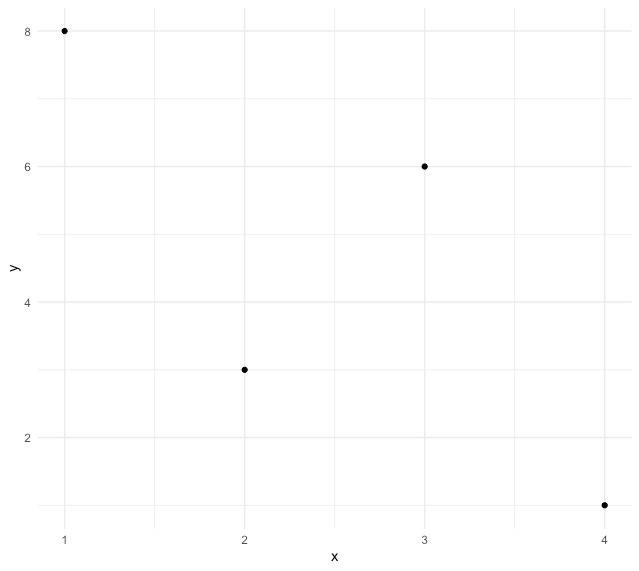
theme_minimal(): 这个主题是用来去除背景注释的。
# Importing ggplot2
library(ggplot2)
# Creating a data frame
data_frame1 = data.frame(x= c(2,4,3,1),
                         y = c(3,1,6,8))
# Plotting the data
ggplot(data_frame1,aes(x = x , y =y)) +
  geom_point()+
  theme_minimal()
输出
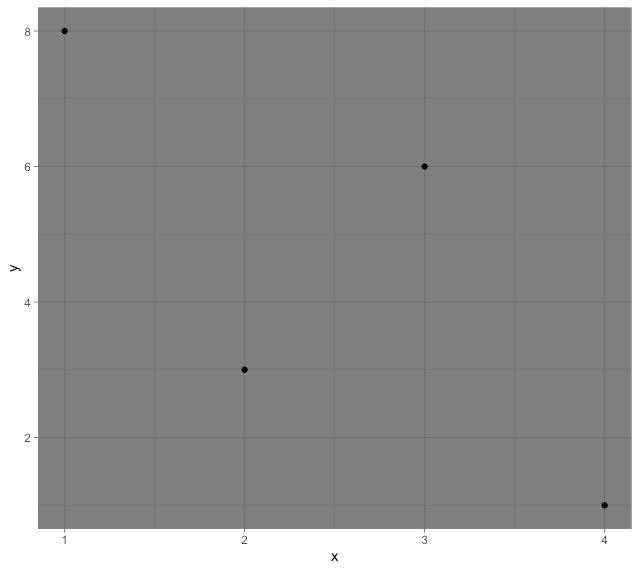
theme_dark(): 它被用来创建一个深色的背景主题,结果是图形的元素被更好地凸显出来。
# Importing ggplot
library(ggplot2)
# Creating a data frame
data_frame1 = data.frame(x= c(2,4,3,1),
                         y = c(3,1,6,8))
# Plotting the data
ggplot(data_frame1,aes(x = x , y =y)) +
  geom_point()+
  theme_dark()
输出
theme_void(): 用来删除背景主题。
# Importing ggplot
library(ggplot2)
# Creating a data frame
data_frame1 = data.frame(x= c(2,4,3,1),
                         y = c(3,1,6,8))
# Plotting the data
ggplot(data_frame1,aes(x = x , y =y)) +
  geom_point()+
  theme_void()
输出

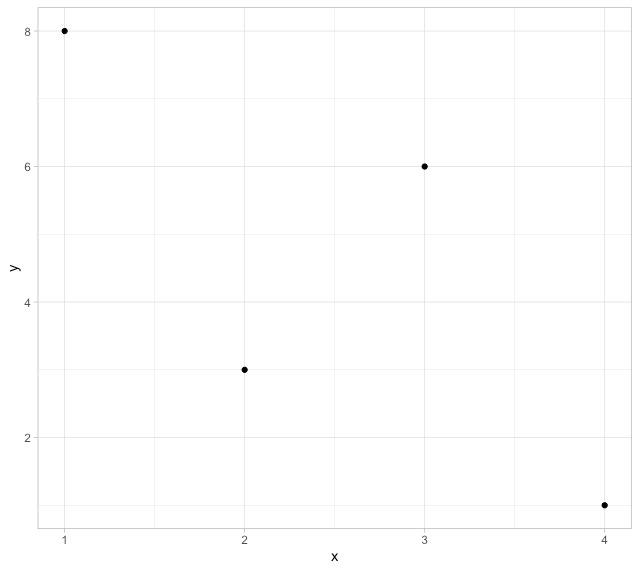
theme_light(): 它用于以浅灰色线条和轴的形式绘制数据。
#installing the required library
library(ggplot2)
#creating a data frame
data_frame1 = data.frame(x= c(2,4,3,1),
                         y = c(3,1,6,8))
#plotting the data
ggplot(data_frame1,aes(x = x , y =y)) +
  geom_point()+
  theme_light()
输出
改变图中绘制点的颜色
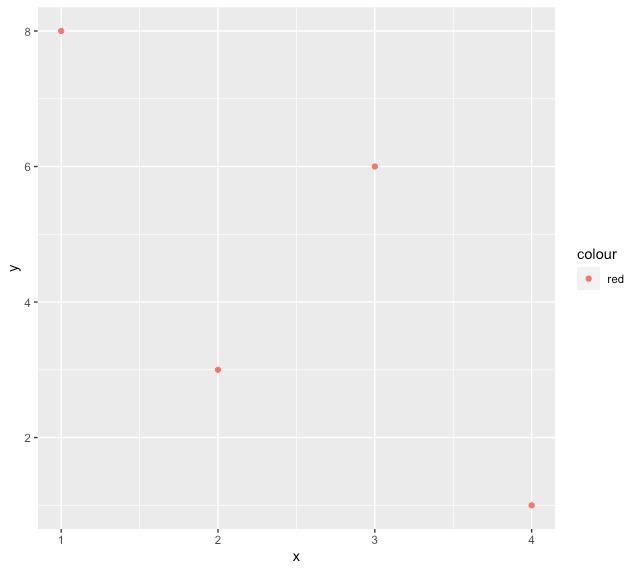
geom_point() 方法以美学映射为参数,可以通过指定颜色来修改点的颜色。
# Importing ggplot2
library(ggplot2)
# Creating a data frame
data_frame1 = data.frame(x= c(2,4,3,1),
                         y = c(3,1,6,8))
# Plotting the data
ggplot(data_frame1,aes(x = x , y =y)) +
  geom_point(aes(colour="red"))
 极客教程
极客教程