R语言 为ggplot2的个体面注释文本
在这篇文章中,我们将讨论如何在R编程语言中的ggplot2中的Individual facet上注释文本。
为了在R编程语言中绘制切面,我们使用 ggplot2 库中的 facet_grid() 函数。 facet_grid() 用于形成一个由行和列分面变量定义的面板矩阵,即显示数据中存在的所有变量的组合。注释文本有点类似于标签文本,但标签和注释之间的区别是,我们一般不能改变标签的位置和属性,但在注释文本中,没有这种预定义的规则。注释是关于图的额外元数据,而标签是关于图的一段信息,用来识别图。
语法: facet_grid(rows = NULL,cols = NULL,scales = “fixed”,space = “fixed”,shrink = TRUE,.)
参数
- rows, cols : 用于定义行或列维度上的分面组。
- scales :用于设置所有面的比例共享。默认情况下是 “固定 “的,这意味着所有的尺度都在所有的面中共享。如果它们在行间变化,那么刻度将被设置为 “free_x”,如果在列间变化,它将被设置为 “free_y”,对于行和列,它将被设置为 “free”。
- space : 设置面板的大小。默认情况下,它被设置为 “固定”,即所有面板都有相同的尺寸。如果它被设置为 “free_y”,那么它们的高度将与y刻度的长度成比例,如果它被设置为 “free_x”,那么它们的宽度将与x刻度的长度成比例,如果它被设置为 “free”,那么高度和宽度都会变化。
- shrink : 它用于将统计结果的输出适合于屏幕,默认情况下它是true。
首先,加载并安装绘制切面所需的库,即加载ggplot2库并创建一个虚拟数据集。
使用中的数据集
   Name Gender Price
1     A      M     1
2     B      M     2
3     C      F     3
4     D      F     4
5     E      M     5
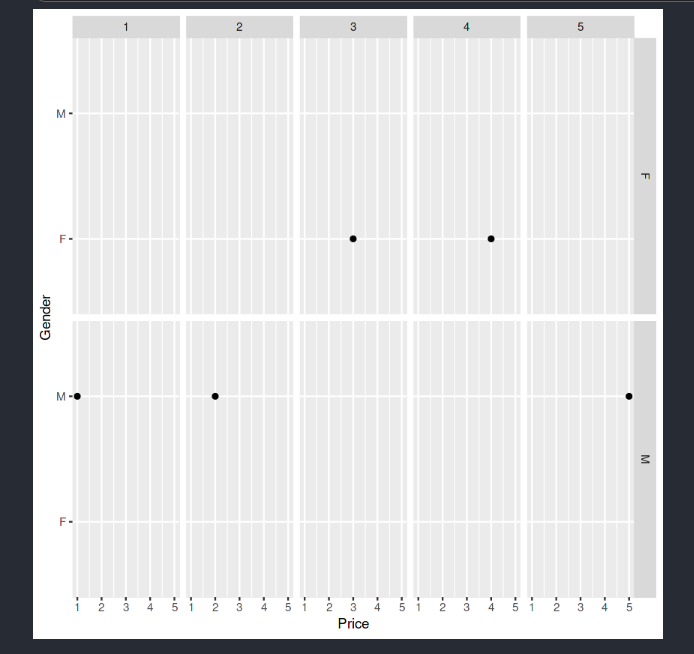
通过传递数据框作为参数,使用ggplot命令绘制数据。让我们先看一下没有注释的图,这样就能看出区别。
例子: 在没有注释文本的情况下绘制各个面的图。
# Facet before adding Annotating text

# installing ggplot2 library
install.packages("ggplot2")

# loading the library
library("ggplot2")

# creating a dummy dataset
people <- c("A","B","C","D","E")
gender <- c("M","M","F","F","M")
price <- c(1,2,3,4,5)

df <- data.frame(Name = people, Gender = gender, Price = price)

# plotting the data using ggplot
plt <- ggplot(

    # providing dataset
    df,

    # to plot price vs Gender
    aes(x=Price, y=Gender)

    # to plot data point as a (.) dot
) + geom_point()

# creating facet from Gender and Price variable
plt <- plt + facet_grid(Gender ~ Price)

# displaying facet plot
plt
输出

添加注释文本前的图谱
要添加文本,请创建你想应用于绘图的自定义注释文本。
例子
ann_dat_text<-data.frame(

Gender=c(“F”,”M”),

Price=c(3,4),

label=c(“Plot 1″,”Plot 2”)

)
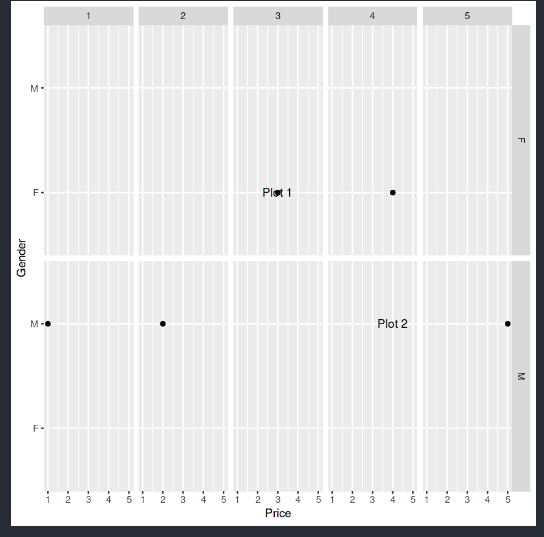
在上面的语句中,我们正在创建一个数据框架,我们要用它来注释文本到面。在这里,我们将标签 “Plot 1 “和 “Plot 2 “应用到两个面,在性别栏的 “F “面,我们将有注释文本 “Plot 1″,在 “M “面,我们将有一个注释文本 “Plot 2″。价格将指定文本的位置。
现在,通过在geom_text()函数中传递适当的参数和所需的值,将这些自定义的文本应用到各个面。
语法
geom_text( data, label)
使用facet_grid,我们已经创建了两个面,在geom_text()中,数据将是新创建的自定义注释数据,我们将用它来在面上应用注释文本。
例子: 对各个面进行注释后的绘图。
# Annotating text on individual facet in ggplot2

# installing ggplot2 library
install.packages("ggplot2")

# loading the library
library("ggplot2")

# creating a dummy dataset
people <- c("A","B","C","D","E")
gender <- c("M","M","F","F","M")
price <- c(1,2,3,4,5)

df <- data.frame(Name = people, Gender = gender, Price = price)

# plotting the data using ggplot
plt <- ggplot(

    # providing dataset
    df,

    # to plot price vs Gender
    aes(x=Price, y=Gender)

    # to plot data point as a (.) dot
) + geom_point()


# creating a dataframe for annotating text
ann_dat_text<-data.frame(

    # Providing F as an annotation of Plot 1
    # and M as an annotation of Plot 2
    Gender=c("F","M"),
    Price=c(3,4),
    label=c("Plot 1","Plot 2")
)

# creating facet from Gender and Price variable
plt <- plt + facet_grid(Gender ~ Price)

# annotating the graph with the custom label made
plt + geom_text(

    # the new dataframe for annotating text
    data = ann_dat_text,
    label=ann_dat_text$label
)
输出

注释的文本到一个面
 极客教程
极客教程