R语言 为绘图添加更多的点 – points()函数
R语言中的 point() 函数用于在现有的绘图中添加一组具有指定形状、大小和颜色的点。
语法: points(x, y, cex, pch, col)
参数:
x, y: 坐标矢量
cex: 点的大小
pch: 点的形状
col: 点的颜色
散点图样本
# R program to create a scatter plot

# Creating coordinate vectors
x <- c(1.3, 3.5, 1.4, -3.1, 5.7, 2.4, 3.3, 2.5, 2.3, 1.9, 1.8, 2.3)
y <- c(2.5, 5.8, 2.1, -3, 12, 5, 6.2, 4.8, 4.2, 3.5, 3.7, 5.2)

# Plotting the graph
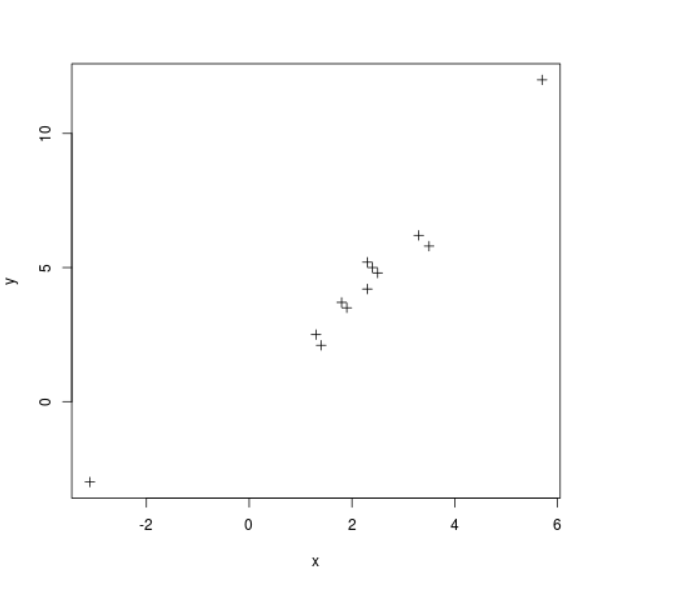
plot(x, y, cex = 1, pch = 3, xlab ="x", ylab ="y", col ="black")
输出:

这里,创建了一个添加点的散点图样本。
例1:在散点图中添加点
# R program to add points to a plot

# Creating coordinate vectors
x <- c(1.3, 3.5, 1.4, -3.1, 5.7, 2.4, 3.3, 2.5, 2.3, 1.9, 1.8, 2.3)
y <- c(2.5, 5.8, 2.1, -3, 12, 5, 6.2, 4.8, 4.2, 3.5, 3.7, 5.2)
plot(x, y, cex = 1, pch = 3, xlab ="x", ylab ="y", col ="black")

# Creating coordinates to be added
x2 <- c(4.2, 1.2, -2.4, -0.3, -1.3, 2.5)
y2 <- c(2.4, 4.3, 1.4, 2.3, -2, 4.5)

# Calling points() function
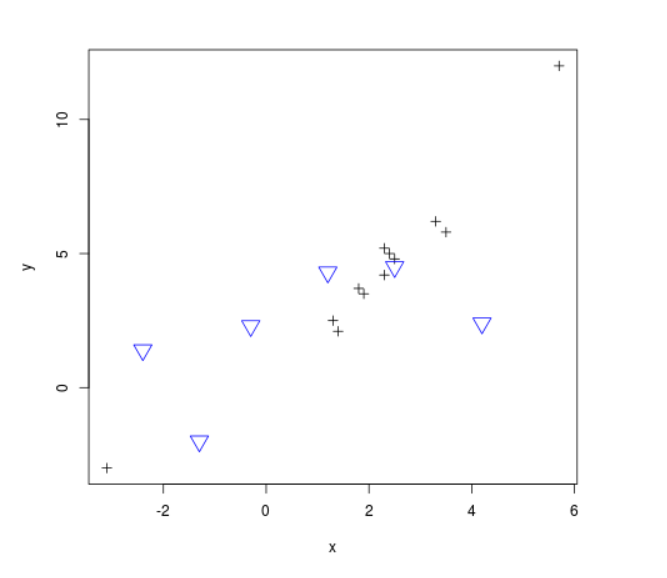
points(x2, y2, cex = 2, pch = 6, col ="blue")
输出:

例2:添加不同属性的点
# R program to add points to a plot

# Creating coordinate vectors
x <- c(1.3, 3.5, 1.4, -3.1, 5.7, 2.4, 3.3, 2.5, 2.3, 1.9, 1.8, 2.3)
y <- c(2.5, 5.8, 2.1, -3, 12, 5, 6.2, 4.8, 4.2, 3.5, 3.7, 5.2)
plot(x, y, cex = 1, pch = 3, xlab ="x", ylab ="y", col ="black")

# Creating coordinates to be added
x2 <- c(4.2, 1.2, -2.4, -0.3, -1.3, 2.5)
y2 <- c(2.4, 4.3, 1.4, 2.3, -2, 4.5)

# Calling points() function
points(x2, y2, cex = 2, pch = 6, col ="blue")

# Adding points of different shape and size
x3 <- c(4, 0)
y3 <- c(7, -2)

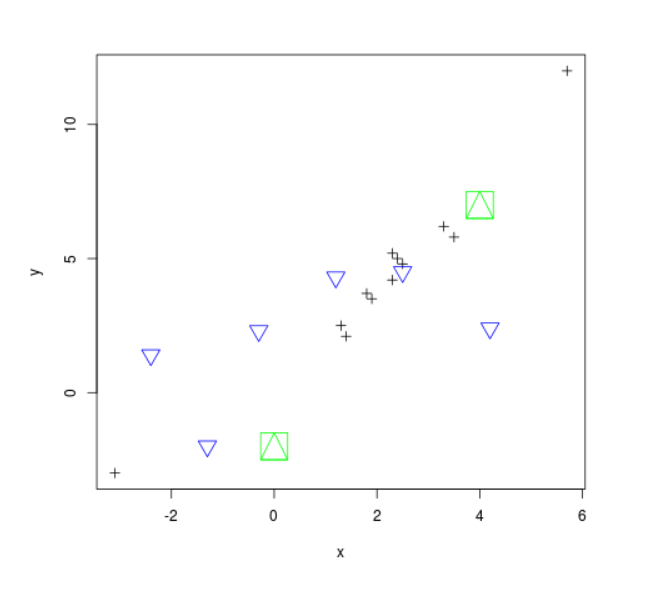
points(x3, y3, cex = 4, pch = 14, col ="green")
输出:

 极客教程
极客教程