R语言 如何使用ggplot2绘制一条平滑线
在这篇文章中,我们将学习如何使用R编程语言中的ggplot2绘制一条平滑线。
我们将使用 “USArrests “数据集作为本文的一个样本数据集。
 Murder Assault UrbanPop Rape
Alabama      13.2     236       58 21.2
Alaska       10.0     263       48 44.5
Arizona       8.1     294       80 31.0
Arkansas      8.8     190       50 19.5
California    9.0     276       91 40.6
Colorado      7.9     204       78 38.7
让我们首先绘制回归线。
语法
geom_smooth(method= lm )
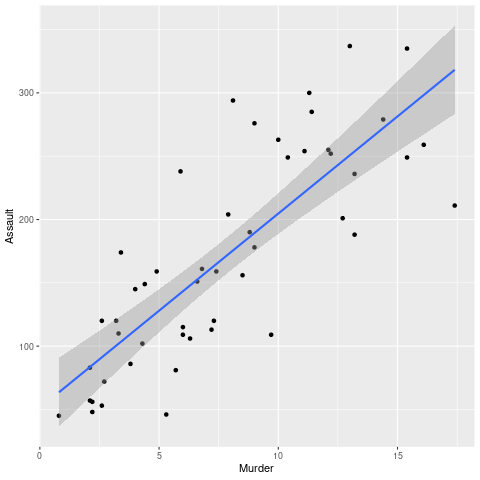
我们使用 geom_smooth ()函数,通过提供 “method=lm “作为参数,在我们的散点图上添加一条回归线。我们已经设置了 method=lm ,因为 lm 代表线性模型,它绘制了一条线性回归线。
但是我们可以在下面的例子中看到,尽管线性回归线是一条最佳拟合线,但它并不是一条平滑的线。在本文中,我们将看到如何使用多种方法绘制一条平滑线。
例子
library(ggplot2)

plot <- ggplot(USArrests, aes(Murder,Assault)) + geom_point()

plot + geom_smooth(method = lm)
输出
方法一:使用geom_smooth()函数的 “loess “方法
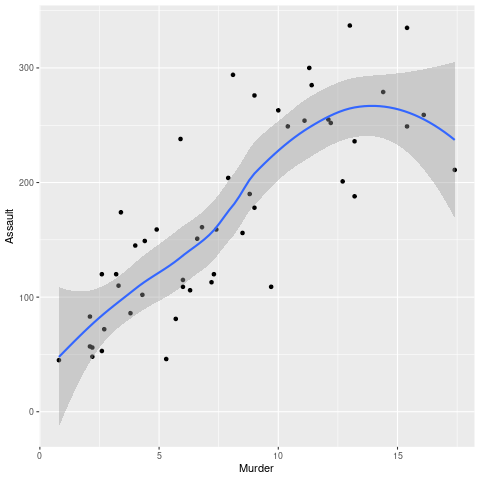
我们可以使用geom_smooth()函数的 “loess “方法绘制一条平滑线。唯一不同的是,在这种情况下,我们传递了 方法=loess,而 不像前面的 lm 。这里,”loess “代表 “局部回归拟合 “。该方法绘制了一条平滑的局部回归线。
语法
geom_smooth(method = loess )
例子
library(ggplot2)

plot <- ggplot(USArrests, aes(Murder,Assault)) + geom_point()

plot + geom_smooth(method = loess)
输出
方法2:使用多项式内插法
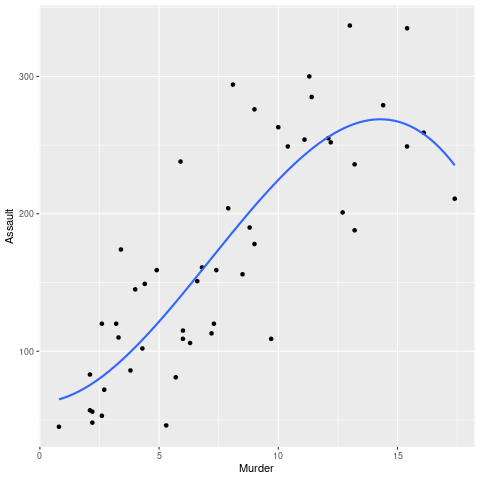
我们也可以使用公式: y~ploy(x,3), 同时使用线性模型方法,这样就可以得到和前面例子一样的平滑线。在参数中传递 ” se ” 为 FALSE 。默认情况下, “se “的值保持为 “true”,这将导致在平滑线周围绘制一个置信区间。
语法
geom_smooth(method = “lm”, formula = y ~ poly(x, 3) , se = FALSE)
例子
library(ggplot2)

plot <- ggplot(USArrests, aes(Murder,Assault)) + geom_point()

plot + geom_smooth(method = "lm", formula = y ~ poly(x, 3), se = FALSE)
输出
方法3:使用 stat_smooth ()函数和 “loess “方法
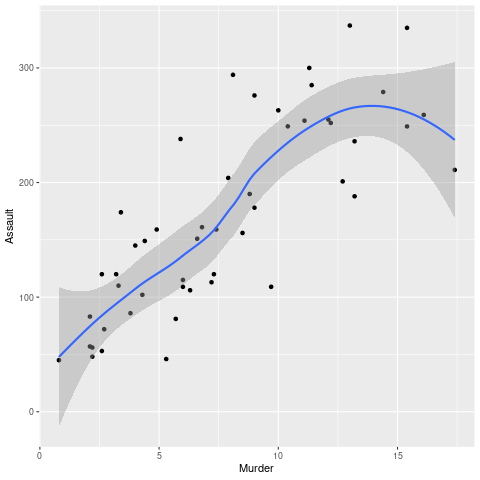
stat_smooth()和geom_smooth()都是同义词。它们都有相同的参数,都是用来绘制平滑线的。我们可以使用 stat_smooth() 函数的 “loess “方法绘制一条平滑线。唯一不同的是,在这种情况下,我们传递了method= loess ,而不像前面的lm。这里,”loess “代表了 “局部回归拟合 “。该方法绘制了一条平滑的局部回归线。
语法 :
stat_smooth(method = loess)
例子
library(ggplot2)

plot <- ggplot(USArrests, aes(Murder, Assault)) + geom_point()

plot + stat_smooth(method = loess)
输出
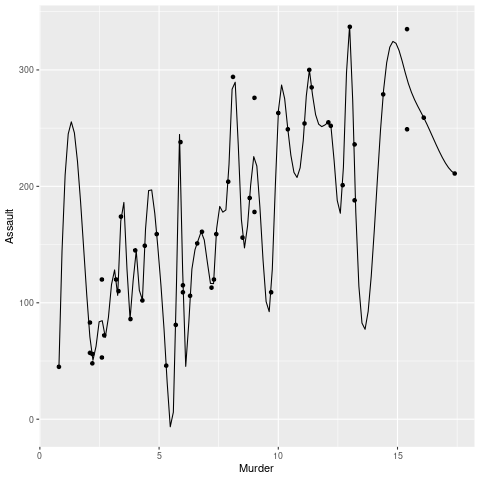
方法4:样条内插法
花键回归是一种更好的方法,因为它克服了多项式回归的缺点,因为多项式回归只能表达特定数量的曲率。简单地说,花键是分片的多项式函数。
要绘制花样图,请在传递数据框架进行绘图时使用花样图函数。
语法
spline( attributes )
例子
library(ggplot2)

spline.d <- as.data.frame(spline(USArrestsMurder, USArrestsAssault))

plot <- ggplot(USArrests, aes(x = Murder, y = Assault))+geom_point() +
geom_line(data = spline.d, aes(x = x, y = y))
plot
输出
 极客教程
极客教程