R语言 如何轻松地创建州和县的地图
在这篇文章中,我们将讨论如何在R编程语言中创建州和县的地图,以及如何用不同的颜色强度和不同的使用情况绘制这种地图。
与使用其他传统的可视化方法相比,二维版本的国家和州的地图更简单,更容易可视化。如果我们想了解哪个州的人口数量最多,或者哪个州的年度预算最少,对于这样的问题陈述,地图是最简单的可视化方法。
这里我们将使用tidyverse包来利用地图数据集和ggplot包来绘制地图。
安装
为了安装和加载tidyverse,在终端键入以下命令。
安装软件包 – install.packages(“tidyverse”) ko
加载软件包 - library(“tidyverse”)
分步实现
第1步:加载内置的地图数据
使用map_data( )函数,我们可以加载tidyverse软件包中内置的地图数据集。
语法: map_data(map, region = “.”, exact = FALSE, …)
参数。
- map – 由地图包提供的地图的名称
- region – 要包括的子区域的名称
- exact – 作为正则表达式(FALSE)或固定字符串(TRUE)的区域
例子:
在这个例子中,我们将从州、国家USA和rests、USA、world和world2数据集加载数据。
# load the package
library("tidyverse")

# Loading map data
states < - map_data("state")
countries < - map_data("county")
arrests < - USArrests
usa < -map_data("usa")
world < -map_data("world")
world2 < -map_data("world2")
第2步:绘制地图数据
在这里,我们将在R中写一个用户定义的函数,用上面加载的数据集绘制地图。我们把用于填充地图的数据集、x、y和列作为该函数的参数。使用ggplot( )函数来绘制地图。guards( )函数用来避免地图上的图例。
语法: ggplot(data = NULL, mapping = aes(), …)
参数。
- data – 数据集
- mapping – 绘图时使用的美学贴图
例子 :
在这里,我们正在编写一个函数,使用内置的地图数据绘制地图
# Function to plot maps using in-built map data
map <- function(x,y,dataset,fill_column){
  p <- ggplot(data = dataset,
              mapping = aes(x = x, y = y, group = group, fill = fill_column))
  p + geom_polygon() + guides(fill = FALSE)
}
例子 :在地图上按地区绘制美国地图
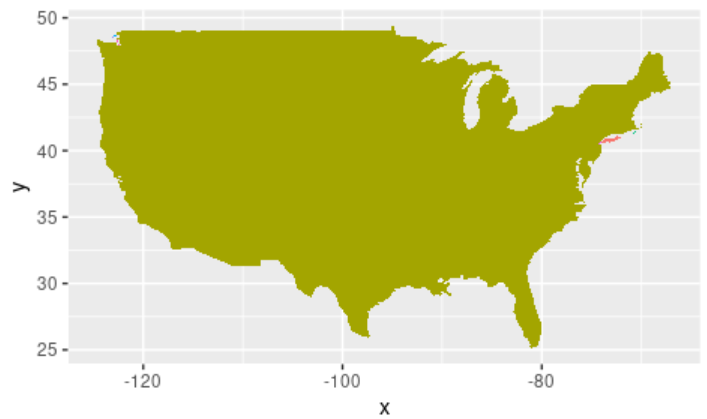
使用之前创建的map( )函数,让我们绘制一张美国的地图。使用usa数据集和上面创建的用户定义的函数,让我们通过一个图来进行可视化。我们还把经度、纬度、usa数据集和usa中的地区列作为参数传给map( )函数。
library(tidyverse)

# Loading map data
states <- map_data("state")
coicountries <- map_data("country")
arrests <- USArrests
usa <-map_data("usa")
world <-map_data("world")
world2<-map_data("world2")

# Function to plot maps using in-built map data
map <- function(x,y,dataset,fill_column){
  p <- ggplot(data = dataset,
              mapping = aes(x = x, y = y, group = group, fill = fill_column))
  p + geom_polygon() + guides(fill = FALSE)
}

# entire USA on map
map(usalong,usalat,usa,usa$region)
输出:
例子 :在地图上按地区绘制美国各州图
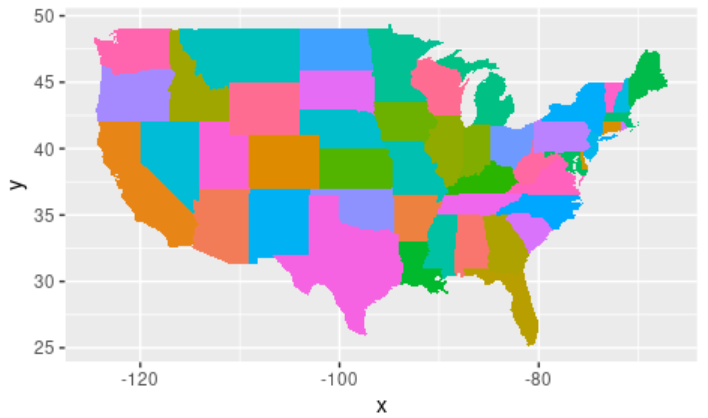
在这里,我们将按州填写美国地图,可以用不同的颜色进行可视化。在州数据集中,使用 “地区 “列,我们可以在美国地图上显示所有的州。我们还把经度、纬度、州数据集和州中的区域列作为参数传给map( )函数。
library(tidyverse)

# Loading map data
states <- map_data("state")
countries <- map_data("county")
arrests <- USArrests
usa <-map_data("usa")
world <-map_data("world")
world2<-map_data("world2")

# Function to plot maps using in-built map data
map <- function(x,y,dataset,fill_column){
  p <- ggplot(data = dataset,
              mapping = aes(x = x, y = y, group = group, fill = fill_column))
  p + geom_polygon() + guides(fill = FALSE)
}

# plotting USA states
map(stateslong,stateslat,states,states$region)
输出 :
例子 :按次区域绘制美国各县的经纬度图
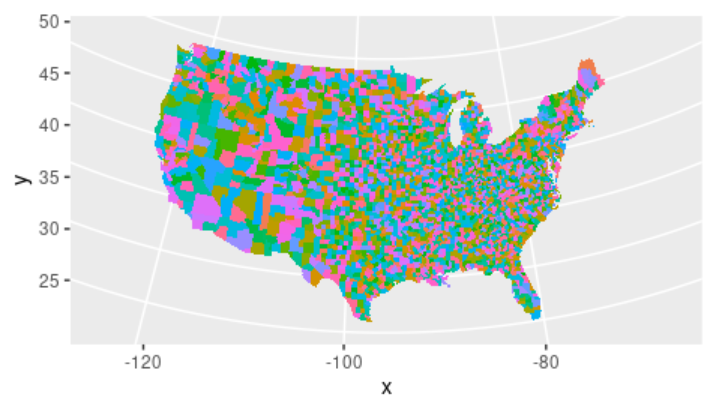
让我们看看如何使用coord_map( )函数向上述地图添加坐标。 这样做是为了给地图带来一个地球仪的效果。我们可以进一步直观地看到美国各州内的各个子区域。
语法: coord_map(projection = “mercator”, orientation = NULL,xlim = NULL,ylim = NULL …)
参数。
- projection – 要使用的投影
- orientation – 投影方向
- xlim – x限制(经度/纬度)。
- ylim – y限制(经度/纬度)。
library(tidyverse)

# Loading map data
states <- map_data("state")
counties <- map_data("county")
arrests <- USArrests
usa <-map_data("usa")
world <-map_data("world")
world2<-map_data("world2")

# Function to plot maps using in-built map data
map <- function(x,y,dataset,fill_column){
  p <- ggplot(data = dataset,
              mapping = aes(x = x, y = y, group = group, fill = fill_column))
  p + geom_polygon() + guides(fill = FALSE)
}

# US counties by subregion with latitude and longitude
map(countieslong,countieslat,counties,counties$subregion) +
coord_map("albers",  lat0 = 45.5, lat1 = 29.5)
输出:
例子 :绘制世界地图
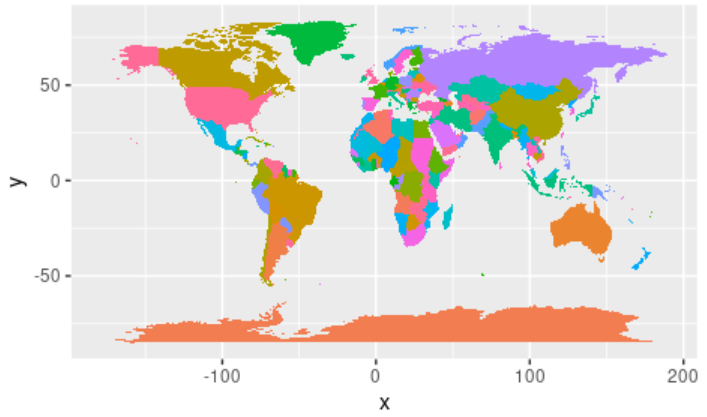
下面我们来看看如何使用map( )函数和世界数据集来绘制世界地图。使用世界数据集和上面定义的用户自定义函数,将经度、纬度、世界数据集和世界中的区域列作为参数传给map( ) 函数。
library(tidyverse)

# Loading map data
states <- map_data("state")
counties <- map_data("county")
arrests <- USArrests
usa <-map_data("usa")
world <-map_data("world")
world2<-map_data("world2")

# Function to plot maps using in-built map data
map <- function(x,y,dataset,fill_column){
  p <- ggplot(data = dataset,
              mapping = aes(x = x, y = y, group = group, fill = fill_column))
  p + geom_polygon() + guides(fill = FALSE)
}

# World Map using world dataset
map(worldlong,worldlat,world,world$region)
输出:
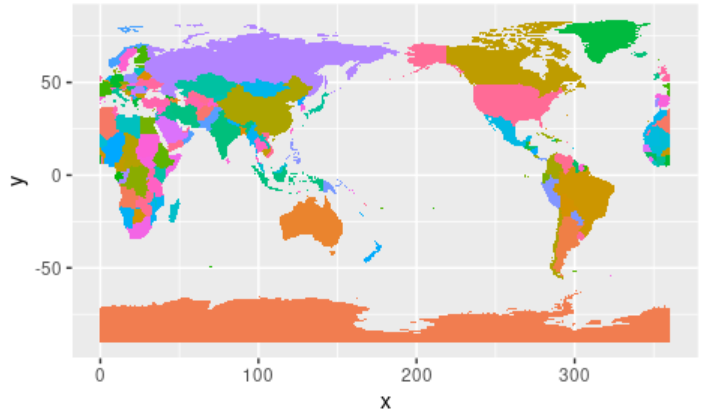
例子。世界2号数据集,纬度有变化
这是另一张使用world2数据集的世界地图,其中有一个纬度的变化。使用map( )函数和world2数据集,将经度、纬度、world2数据集和world2中的地区列作为参数传给map( )函数。
library(tidyverse)

# Loading map data
states <- map_data("state")
counties <- map_data("county")
arrests <- USArrests
usa <-map_data("usa")
world <-map_data("world")
world2<-map_data("world2")

# Function to plot maps using in-built map data
map <- function(x,y,dataset,fill_column){
  p <- ggplot(data = dataset,
              mapping = aes(x = x, y = y, group = group, fill = fill_column))
  p + geom_polygon() + guides(fill = FALSE)
}

# World Map using world2 dataset
map(world2long,world2lat,world2,world2$region)
输出:
 极客教程
极客教程