R语言 如何改变ggvis图的最大和最小标签
R语言中的绘图是用来以图形的形式描述数据的,用坐标来表示各点。一个图有两个轴,即x轴和y轴。x轴和y轴分别用标签表示,即最小值和最大值。在R中,有多个外部包用于绘制图。
R中的ggplot2库被用来对所提供的数据进行图形化表示。该软件包可以通过以下命令下载并安装到工作空间。
install.packages("ggplot2")
最初使用data.fram()方法创建一个数据框架。数据点被构建在数据框中。使用管道操作符对数据框进行ggvis操作。ggvis方法用于启动ggvis图形窗口。ggvis方法的语法如下。
ggvis( data , mp1, mp2.,)
参数 :
- data – 要绘制的数据集
- mp1, mp2,… – 要绘制的地图变量
然后添加add_axis方法,为绘制的图形的坐标轴提供标签。它可以用来覆盖坐标轴的默认值。
add_axis( vis, axes , values = )
参数。
- vis – 用于绘图的ggvis对象
- axes – 用于绘图的坐标轴
- values – 用于绘制标签的刻度线的值。
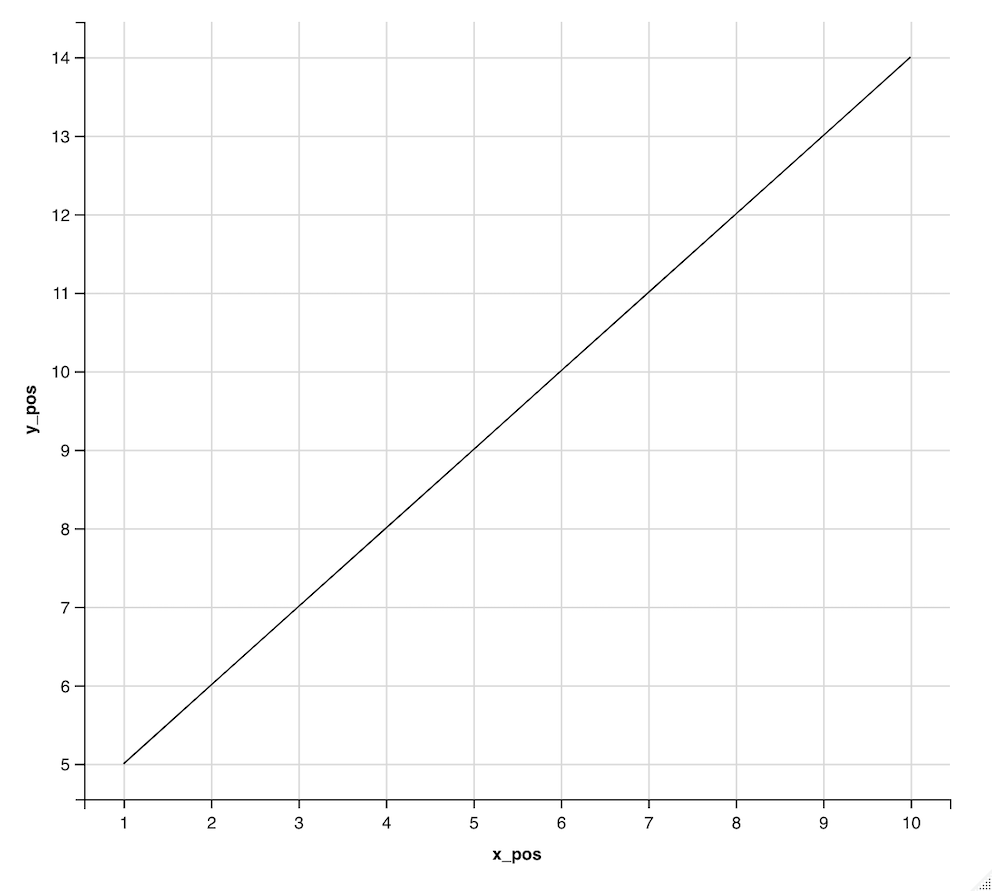
默认情况下,标签分别基于x和y数据点的值。例如,在下图中,y轴的标签是根据5到14的数值指定的。x_pos中的数据点在区间1到10之间,而y_pos中的数据点在区间5到14之间,因此,标签是在这些数值之间绘制的。
# installing the required libraries
library(ggplot2)
library(ggvis)

# creating the data frame by defining the
# x and y coordinates respectively
x_pos <- 1:10

# defining the y axis
y_pos = 5:14

# creating the data frame
data_frame = data.frame(x_pos, y_pos )
print("Data Frame")
print(data_frame)

# plotting the tick marks on the axes
data_frame %>%
  ggvis(~x_pos,~y_pos) %>%
  layer_lines() %>%
  # adding customised tick marks to the axes
  add_axis("x", values=x_pos)  %>%
  add_axis("y", values = y_pos)
输出
[1] "Data Frame"
  x_pos y_pos
1      1     5
2      2     6
3      3     7
4      4     8
5      5     9
6      6    10
7      7    11
8      8    12
9      9    13
10    10    14

ggvis包中的scale_numeric()方法是用来创建y轴的标签的。它被用来提供Y轴的自定义标签。
scale_numeric ( axis, domain = )
参数 :
- Axis – 用于绘制自定义Y轴刻度的坐标轴
- domain – 分别用于指定轴的上界和下界的范围。
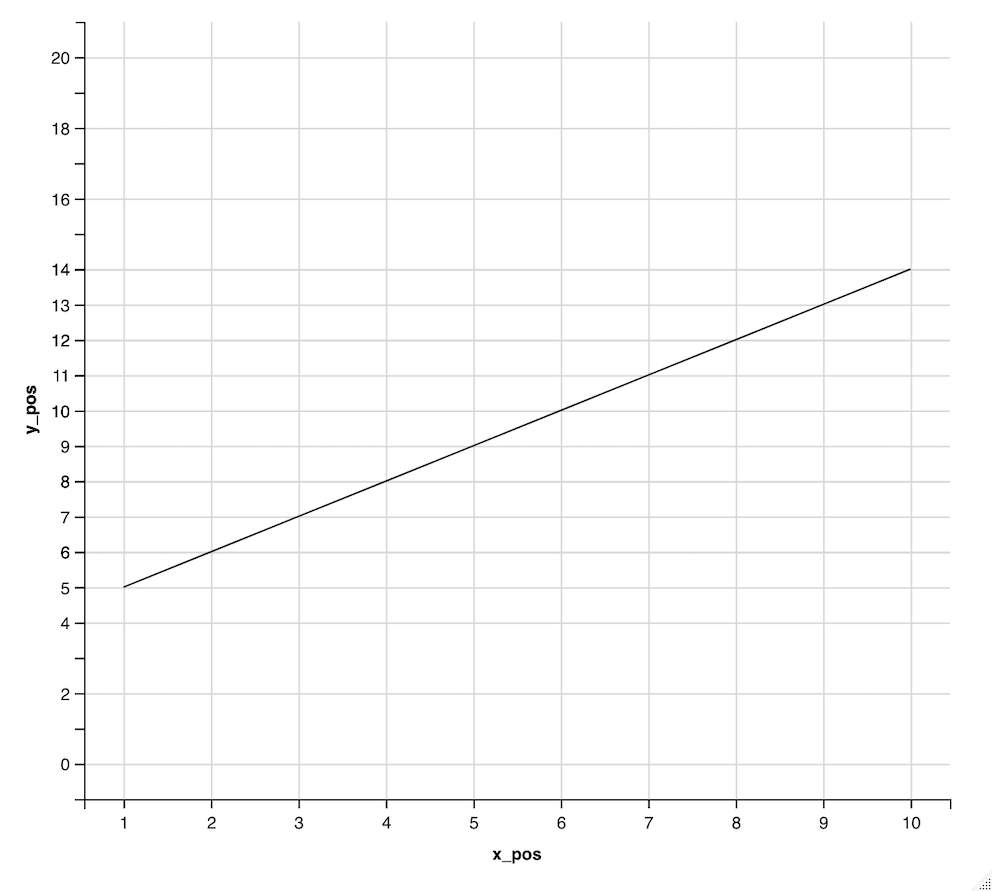
下面的代码片段将y坐标的域改为(0,20)区间的值。这些值从相当于5的值开始绘制,直到14。
# installing the required libraries
library(ggplot2)
library(ggvis)

# creating the data frame by defining
# the x and y coordinates respectively
x_pos <- 1:10

# defining the y axis
y_pos = 5:14

# creating the data frame
data_frame = data.frame(x_pos, y_pos )
print("Data Frame")
print(data_frame)

# plotting the tick marks on the axes
data_frame %>%
  ggvis(~x_pos,~y_pos) %>%
  layer_lines() %>%

  # adding customised tick marks to the axes
  add_axis("x", values=x_pos)  %>%
  add_axis("y", values = y_pos) %>%

  # specifying the range of y labels
  scale_numeric("y", domain = c(0, 20)) %>%

  # dividing the axis in the ratio of 1 segment
  add_axis("y", subdivide = 1)
输出
[1] "Data Frame"
  x_pos y_pos
1      1     5
2      2     6
3      3     7
4      4     8
5      5     9
6      6    10
7      7    11
8      8    12
9      9    13
10    10    14

 极客教程
极客教程