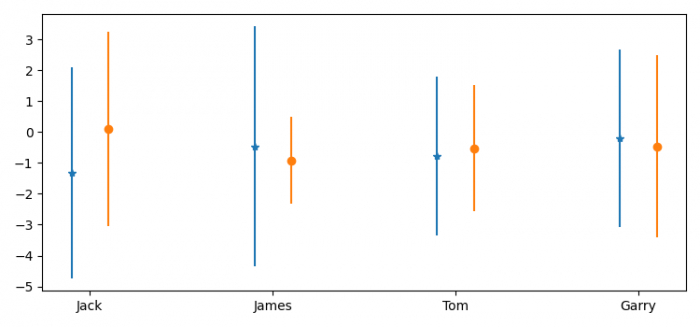
如何在matplotlib中避免重叠的误差线?
为了避免在matplotlib中重叠的误差线,我们可以采取以下步骤-
步骤
-
设置图形大小并调整子图之间和周围的填充。
-
创建名称列表。
-
获取y1和y2的数据点,以及误差ye1,ye2。
-
创建一个图形和一组子图。
-
创建一个可变的2D仿射变换, trans1 和 trans2 。
-
将y与x绘制为带有附加误差栏的线和/或标记。
-
使用 show() 方法显示图形。
例子
import numpy as np
import matplotlib.pyplot as plt
from matplotlib.transforms import Affine2D

plt.rcParams["figure.figsize"] = [7.50, 3.50]
plt.rcParams["figure.autolayout"] = True

x = ['Jack', 'James', 'Tom', 'Garry']

y1, y2 = np.random.randn(2, len(x))

ye1, ye2 = np.random.rand(2, len(x))*4+0.3

fig, ax = plt.subplots()

trans1 = Affine2D().translate(-0.1, 0.0) + ax.transData
trans2 = Affine2D().translate(0.1, 0.0) + ax.transData

er1 = ax.errorbar(x, y1, yerr=ye1, marker="*", linestyle="none", transform=trans1)
er2 = ax.errorbar(x, y2, yerr=ye2, marker="o", linestyle="none", transform=trans2)

plt.show()
输出
它将产生以下输出-

 极客教程
极客教程