如何使用TensorFlow来验证Python中Fashion MNIST的预测?
Tensorflow是由Google提供的机器学习框架。它是一个开源框架,与Python一起用于实现算法、深度学习应用等等。它用于研究和生产目的。
使用如下代码行可在Windows上安装’tensorflow’软件包−
pip install tensorflow
‘Fashion MNIST’数据集包含不同种类的服装的图像。它包含属于10个不同类别的70,000多件衣服的灰度图像。这些图像分辨率较低(28 x 28像素)。
我们使用Google Colaboratory运行以下代码。Google Colab或Colaboratory可以在浏览器上运行Python代码,并且不需要任何配置,免费访问GPU(图形处理器)。 Colaboratory是基于Jupyter Notebook构建的。
以下是验证Python下Fashion MNIST预测的代码片段−
更多Python相关文章,请阅读:Python 教程
示例
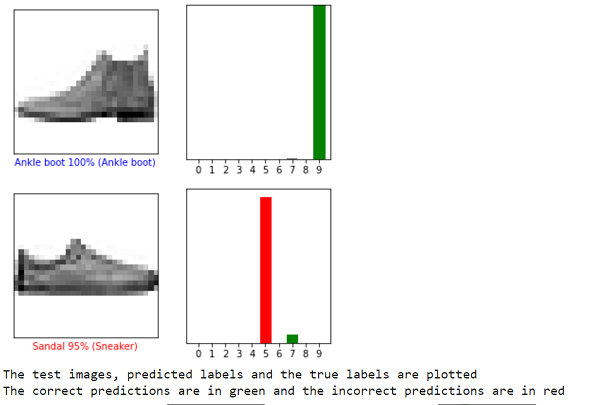
i = 0
plt.figure(figsize=(6,3))
plt.subplot(1,2,1)
plot_image(i, predictions[i], test_labels, test_images)
plt.subplot(1,2,2)
plot_value_array(i, predictions[i], test_labels)
plt.show()

i = 12
plt.figure(figsize=(6,3))
plt.subplot(1,2,1)
plot_image(i, predictions[i], test_labels, test_images)
plt.subplot(1,2,2)
plot_value_array(i, predictions[i], test_labels)
plt.show()

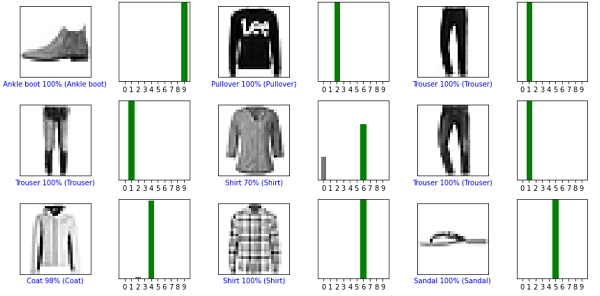
num_rows = 5
num_cols = 3
print("测试图像、预测标签和真实标签被绘制")
print("正确的预测是绿色的,错误的预测是红色的")
num_images = num_rows*num_cols
plt.figure(figsize=(2*2*num_cols, 2*num_rows))
for i in range(num_images):
plt.subplot(num_rows, 2*num_cols, 2*i+1)
plot_image(i, predictions[i], test_labels, test_images)
plt.subplot(num_rows, 2*num_cols, 2*i+2)
plot_value_array(i, predictions[i], test_labels)
plt.tight_layout()
plt.show()
代码来源 − https://www.tensorflow.org/tutorials/keras/classification
输出


解释
-
一旦模型已被训练,就可以在其他图像上进行预测。
-
预测是在图像上进行的,并显示预测数组。
-
预测正确的标签为绿色,预测不正确的标签为红色。
-
数字表示预测标签的百分比值。
-
它告诉我们模型建议的标签是图像的实际标签的准确度。
 极客教程
极客教程