如何在Pandas中利用时间序列
python中的pandas库提供了一套标准的时间序列工具和数据算法。通过这一点,我们可以有效地处理非常大的时间序列,并轻松地对不规则和固定频率的时间序列进行切片和切块、聚合和重新采样。
时间序列数据是结构化数据的一种重要形式,被用于金融、经济、生态学等领域。任何在许多时间点上被观察或测量的东西都构成了时间序列。
1.时间戳。这些是时间上的特定时刻
2.固定时期。这将代表诸如5月25日的月份或1999年全年。
DateTime中的模块
- date:该模块用于存储年、月、日格式的日历。
- time:该模块用于获取和显示小时、分钟、秒和微秒格式的时间。
- datetime:该模块用于存储日期和时间。
- Timedelta:该模块用于获取两个日期时间值之间的差异。
以下是描述如何利用pandas库中的时间序列的各种例子:
例子1:显示当前日期和时间。在这个程序中,我们将显示当前的日期和时间。
# import datetime module
# for getting date and time
from datetime import datetime

# command to display
# current date and time
datetime.now()
输出:

例子2:程序从模块中单独显示小时、分钟、秒、月、年、日。
# import module
from datetime import datetime

# display all attributes
a=datetime.now()
print(a.year)
print(a.day)
print(a.month)
print(a.hour)
print(a.minute)
print(a.second)
print(a.microsecond)
print(a.date)
输出:

例子3:两个日期之间的差异。我们可以使用timedelta模块获得小时、天和分钟的差异。
# importing time delta module
from datetime import timedelta

# subtracting date from year 2027 to 2021
deltaresult = datetime(2027, 5, 7) - datetime(2021, 6, 24)

# display the result
print(deltaresult)

# to get days
print(deltaresult.days)

# to get seconds difference
print(deltaresult.seconds)
输出:

如果我们想生成时间序列数据,python将支持date_range模块。这将生成给定频率内的日期。它在pandas模块中可用。
语法:
pandas.date_range(start=None, end=None, periods=None, freq=None)
参数:
- start:从开始日期开始的时间。
- end:指定结束日期时间。
- freq:代表一个频率,如小时、分钟或秒。
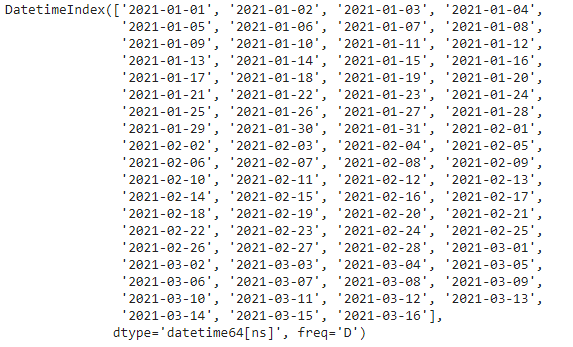
示例4:在这个程序中,我们可以从2021年1月1日开始,使用date_range方法显示到3月的日期。
# importing pandas module
import pandas as pd

# using date_range function to generate
# dates from january 1 2021 to
# march 16 2021 as periods = 75
dates = pd.date_range('1/1/2021', periods=75)

print(dates)
输出:
通过使用时间序列作为索引,生成对应日期的数值。
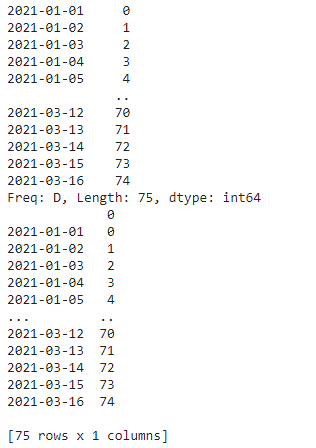
例子5:在这个程序中,我们通过设置日期作为每个值的索引来给日期取值。
# importing pandas module
import pandas as pd
# importing numpy module for generating values
import numpy as np

# using date_range function to generate dates
# from january 1 2021 to march 16 2021 as periods = 75
dates = pd.date_range('1/1/2021', periods=75)

# giving values to dates
results = pd.Series(np.arange(75), index=dates)

# print results
print(results)

# converting to data frame
print(pd.DataFrame(results))
输出:
我们可以通过以下方法将数据字符串列转换为日期时间类型。
语法:
pandas.to_datetime(column_name)
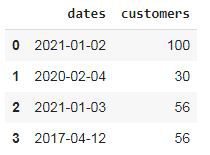
示例6:在这个程序中,我们将把字符串数据转换为日期时间类型。
# importing pandas module for data frame
import pandas as pd

# creating data frame for different customers
# in a shop with respect to dates
data = pd.DataFrame({'dates': ['1/2/2021',
                               '2/4/2020',
                               '1/3/2021',
                               '4/12/2017'],
                     'customers': [100, 30, 56, 56]})

# display original data
data

# converting dates column to date
# using pandas.to_datetime function
data['dates'] = pd.to_datetime(data['dates'])

# data after conversion
data
输出:
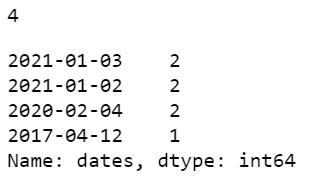
实例7:在这个程序中,我们要把一些时间序列数据作为索引,进行转换,并验证它们是否相等。
# importing pandas module for data frame
import pandas as pd

# creating data frame for different customers
# in a shop with respect to dates
data = pd.DataFrame({'dates': ['1/2/2021', '2/4/2020',
                               '1/3/2021', '4/12/2017',
                               '1/2/2021', '2/4/2020',
                               '1/3/2021'],
                     'customers': [100, 30, 56,
                                   56, 23, 45, 67]})
# display original data
data

# converting dates column to date
# using pandas.to_datetime function
data['dates'] = pd.to_datetime(data['dates'])

# after conversion
data

# finding unique time series data
print(data['dates'].nunique())

# counting each series data
data['dates'].value_counts()
输出:
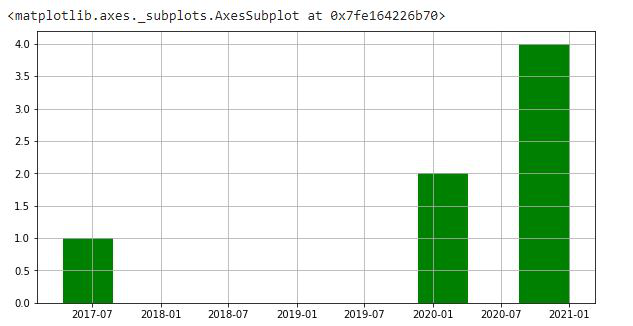
示例8:程序显示具有DateTime对象的数据框的柱状图。
# importing pandas module for data frame
import pandas as pd

# creating data frame for different customers
# in a shop with respect to dates
data = pd.DataFrame({'dates': ['1/2/2021', '2/4/2020',
                               '1/3/2021', '4/12/2017',
                               '1/2/2021', '2/4/2020',
                               '1/3/2021'],
                     'customers': [100, 30, 56,
                                   56, 23, 45, 67]})
# display original data
data

# converting dates column to date
# using pandas.to_datetime function
data['dates'] = pd.to_datetime(data['dates'])

# depict visualization
data['dates'].hist(figsize=(10, 5), color="green")
输出:
 极客教程
极客教程