Pandas GroupBy 按月份分组:高效数据分析与时间序列处理
Pandas是Python中强大的数据处理库,其中GroupBy功能为数据分析提供了极大便利。本文将深入探讨如何使用Pandas的GroupBy功能按月份对数据进行分组,这对于时间序列数据的处理和分析尤为重要。我们将通过详细的解释和丰富的示例代码,帮助您掌握这一重要技能。
1. 理解Pandas中的时间数据
在开始使用GroupBy按月份分组之前,我们需要先了解Pandas中如何处理时间数据。Pandas提供了强大的时间序列功能,可以轻松处理日期和时间数据。
1.1 创建时间序列数据
首先,让我们创建一个包含时间数据的DataFrame:
import pandas as pd
import numpy as np

# 创建一个日期范围
date_rng = pd.date_range(start='2023-01-01', end='2023-12-31', freq='D')

# 创建DataFrame
df = pd.DataFrame(date_rng, columns=['date'])
df['value'] = np.random.randn(len(date_rng))

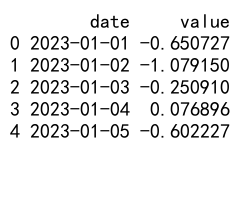
print(df.head())
Output:

这个示例创建了一个包含整年日期和随机值的DataFrame。pd.date_range函数用于生成日期序列,freq='D'表示按天生成。
1.2 提取月份信息
要按月份分组,我们需要从日期中提取月份信息:
# 提取月份信息
df['month'] = df['date'].dt.month

print(df.head())
这里,我们使用dt.month属性从日期列中提取月份信息。这将为每个日期添加一个对应的月份列。
2. 使用GroupBy按月份分组
现在我们已经有了月份信息,可以开始使用GroupBy进行分组操作。
2.1 基本的GroupBy操作
# 按月份分组并计算平均值
monthly_avg = df.groupby('month')['value'].mean()

print(monthly_avg)
这个示例展示了如何按月份分组并计算每月的平均值。groupby('month')将数据按月份分组,然后我们对’value’列应用mean()函数。
2.2 多列操作
我们也可以同时对多个列进行操作:
# 创建更复杂的DataFrame
df['sales'] = np.random.randint(100, 1000, size=len(df))
df['expenses'] = np.random.randint(50, 500, size=len(df))

# 按月份分组并计算多个统计量
monthly_stats = df.groupby('month').agg({
    'value': 'mean',
    'sales': 'sum',
    'expenses': 'sum'
})

print(monthly_stats)
这个例子展示了如何在分组后对不同列应用不同的聚合函数。我们计算了’value’的平均值,以及’sales’和’expenses’的总和。
3. 高级GroupBy技巧
3.1 自定义聚合函数
除了内置的聚合函数,我们还可以使用自定义函数:
def profit_margin(data):
    return (data['sales'].sum() - data['expenses'].sum()) / data['sales'].sum()

monthly_profit_margin = df.groupby('month').apply(profit_margin)

print(monthly_profit_margin)
这个示例定义了一个计算利润率的函数,并将其应用于每个月份组。
3.2 多级分组
我们可以按多个条件进行分组:
# 添加一个类别列
df['category'] = np.random.choice(['A', 'B', 'C'], size=len(df))

# 按月份和类别分组
monthly_category_stats = df.groupby(['month', 'category']).agg({
    'sales': 'sum',
    'expenses': 'mean'
})

print(monthly_category_stats)
这个例子展示了如何按月份和类别进行多级分组,并计算每组的销售总额和平均支出。
4. 时间序列特定操作
Pandas提供了许多专门用于时间序列数据的操作。
4.1 重采样
重采样是一种强大的时间序列操作,可以改变数据的频率:
# 将日数据重采样为月数据
monthly_resampled = df.set_index('date').resample('M')['value'].mean()

print(monthly_resampled)
这个示例将日数据重采样为月数据,计算每月的平均值。resample('M')表示按月重采样。
4.2 滚动窗口计算
滚动窗口计算允许我们计算移动平均等统计量:
# 计算30天滚动平均
df['rolling_mean'] = df.set_index('date')['value'].rolling(window=30).mean()

print(df.head(35))
这个例子计算了30天的滚动平均值。注意,前29天的滚动平均值将是NaN,因为没有足够的数据点。
5. 处理缺失数据
在实际应用中,我们经常会遇到缺失数据的情况。
5.1 填充缺失值
# 创建一个包含缺失值的DataFrame
date_rng = pd.date_range(start='2023-01-01', end='2023-12-31', freq='D')
df_missing = pd.DataFrame(date_rng, columns=['date'])
df_missing['value'] = np.random.randn(len(date_rng))
df_missing.loc[df_missing.index % 10 == 0, 'value'] = np.nan

# 按月份分组并填充缺失值
monthly_filled = df_missing.groupby(df_missing['date'].dt.month)['value'].transform(lambda x: x.fillna(x.mean()))

print(df_missing.head(15))
print(monthly_filled.head(15))
这个示例创建了一个包含缺失值的DataFrame,然后按月份分组并用每月的平均值填充缺失值。
5.2 处理整组缺失的情况
有时,某些月份可能完全没有数据:
# 创建一个某些月份完全缺失的DataFrame
months = pd.date_range(start='2023-01-01', end='2023-12-31', freq='M')
df_sparse = pd.DataFrame({'date': months, 'value': np.random.randn(12)})
df_sparse = df_sparse.drop(df_sparse.index[[1, 5, 9]])  # 删除几个月的数据

# 重建完整的月份索引并填充缺失值
full_months = pd.date_range(start='2023-01-01', end='2023-12-31', freq='M')
df_filled = df_sparse.set_index('date').reindex(full_months).reset_index()
df_filled['month'] = df_filled['index'].dt.month
df_filled['value'] = df_filled.groupby('month')['value'].transform(lambda x: x.fillna(x.mean()))

print(df_filled)
这个例子展示了如何处理整个月份缺失的情况。我们首先创建一个完整的月份索引,然后用现有数据重新索引,最后填充缺失的月份数据。
6. 可视化GroupBy结果
数据可视化是数据分析的重要组成部分。让我们看看如何可视化按月份分组的结果。
6.1 使用Matplotlib绘制柱状图
import matplotlib.pyplot as plt

# 按月份分组并计算平均值
monthly_avg = df.groupby(df['date'].dt.month)['value'].mean()

# 绘制柱状图
plt.figure(figsize=(12, 6))
monthly_avg.plot(kind='bar')
plt.title('Monthly Average Values')
plt.xlabel('Month')
plt.ylabel('Average Value')
plt.xticks(range(12), ['Jan', 'Feb', 'Mar', 'Apr', 'May', 'Jun', 'Jul', 'Aug', 'Sep', 'Oct', 'Nov', 'Dec'])
plt.show()
这个示例展示了如何使用Matplotlib绘制按月份分组后的平均值柱状图。
6.2 使用Seaborn绘制箱线图
import seaborn as sns

# 准备数据
df['month'] = df['date'].dt.month
df['month_name'] = df['date'].dt.strftime('%b')

# 绘制箱线图
plt.figure(figsize=(12, 6))
sns.boxplot(x='month_name', y='value', data=df, order=['Jan', 'Feb', 'Mar', 'Apr', 'May', 'Jun', 'Jul', 'Aug', 'Sep', 'Oct', 'Nov', 'Dec'])
plt.title('Monthly Value Distribution')
plt.xlabel('Month')
plt.ylabel('Value')
plt.show()
这个例子使用Seaborn库绘制了每月值分布的箱线图,可以更好地展示数据的分布情况。
7. 高级应用:时间序列分析
GroupBy按月份分组的功能在时间序列分析中有广泛的应用。
7.1 季节性分析
# 创建一个具有季节性的时间序列
date_rng = pd.date_range(start='2020-01-01', end='2023-12-31', freq='D')
df_seasonal = pd.DataFrame(date_rng, columns=['date'])
df_seasonal['value'] = np.sin(np.arange(len(date_rng)) * 2 * np.pi / 365) + np.random.randn(len(date_rng)) * 0.1

# 按月份分组并计算平均值
monthly_avg = df_seasonal.groupby(df_seasonal['date'].dt.month)['value'].mean()

print(monthly_avg)
这个示例创建了一个具有季节性模式的时间序列,然后按月份分组计算平均值,以揭示季节性趋势。
7.2 年度比较
# 按年和月分组
yearly_monthly_avg = df_seasonal.groupby([df_seasonal['date'].dt.year, df_seasonal['date'].dt.month])['value'].mean().unstack()

# 计算年度差异
yearly_diff = yearly_monthly_avg.diff()

print(yearly_diff)
这个例子展示了如何比较不同年份同月的数据,可以用来分析年度变化趋势。
8. 性能优化技巧
在处理大型数据集时,性能优化变得尤为重要。
8.1 使用分类数据类型
对于重复值较多的列,使用分类数据类型可以显著提高性能:
# 创建一个大型DataFrame
large_df = pd.DataFrame({
    'date': pd.date_range(start='2020-01-01', end='2023-12-31', freq='H'),
    'category': np.random.choice(['A', 'B', 'C', 'D'], size=4*365*24),
    'value': np.random.randn(4*365*24)
})

# 将月份和类别转换为分类类型
large_df['month'] = large_df['date'].dt.month.astype('category')
large_df['category'] = large_df['category'].astype('category')

# 按月份和类别分组
grouped = large_df.groupby(['month', 'category'])['value'].mean()

print(grouped.head())
这个示例展示了如何将月份和类别列转换为分类类型,这可以在大型数据集上显著提高GroupBy操作的性能。
8.2 使用numba加速自定义函数
对于复杂的自定义聚合函数,可以使用numba来加速计算:
from numba import jit

@jit(nopython=True)
def custom_agg(values):
    return np.sum(np.exp(values)) / len(values)

# 应用自定义聚合函数
result = large_df.groupby('month')['value'].apply(custom_agg)

print(result)
这个例子展示了如何使用numba的@jit装饰器来加速自定义聚合函数的执行。
9. 实际应用案例
让我们通过一些实际应用案例来巩固我们所学的知识。
9.1 销售数据分析
# 创建销售数据
sales_data = pd.DataFrame({
    'date': pd.date_range(start='2023-01-01', end='2023-12-31', freq='D'),
    'product': np.random.choice(['A', 'B', 'C'], size=365),
    'sales': np.random.randint(100, 1000, size=365),
    'cost': np.random.randint(50, 500, size=365)
})

# 计算每月每种产品的利润
monthly_profit = sales_data.groupby([sales_data['date'].dt.month, 'product']).apply(lambda x: (x['sales'] - x['cost']).sum()).unstack()

print(monthly_profit)
这个例子展示了如何分析每月每种产品的利润情况。
9.2 气象数据分析
# 创建气象数据
weather_data = pd.DataFrame({
    'date': pd.date_range(start='2020-01-01', end='2023-12-31', freq='D'),
    'temperature': np.random.uniform(0, 30, size=4*365),
    'rainfall': np.random.exponential(5, size=4*365)
})

# 计算每月平均温度和总降雨量monthly_weather = weather_data.groupby(weather_data['date'].dt.month).agg({
    'temperature': 'mean',
    'rainfall': 'sum'
})

print(monthly_weather)
这个例子展示了如何分析每月的平均温度和总降雨量,这在气象数据分析中非常常见。
10. 处理特殊情况
在实际应用中,我们可能会遇到一些特殊情况,需要特别处理。
10.1 处理跨年数据
当数据跨越多个年份时,我们可能需要同时考虑年份和月份:
# 创建跨年数据
multi_year_data = pd.DataFrame({
    'date': pd.date_range(start='2020-01-01', end='2023-12-31', freq='D'),
    'value': np.random.randn(4*365)
})

# 按年和月分组
yearly_monthly_avg = multi_year_data.groupby([multi_year_data['date'].dt.year, multi_year_data['date'].dt.month])['value'].mean().unstack()

print(yearly_monthly_avg)
这个示例展示了如何处理跨越多个年份的数据,通过同时按年和月分组来分析数据。
10.2 处理非标准月份
有时,我们可能需要处理非标准的月份定义,比如财政年度或自定义时间段:
def custom_month(date):
    if date.day < 15:
        return date.month
    else:
        return date.month % 12 + 1

# 创建数据
custom_month_data = pd.DataFrame({
    'date': pd.date_range(start='2023-01-01', end='2023-12-31', freq='D'),
    'value': np.random.randn(365)
})

# 使用自定义月份分组
custom_monthly_avg = custom_month_data.groupby(custom_month_data['date'].apply(custom_month))['value'].mean()

print(custom_monthly_avg)
这个例子展示了如何使用自定义函数定义月份,并据此进行分组。
11. 与其他Pandas功能的结合
GroupBy功能可以与Pandas的其他强大功能结合使用,以实现更复杂的数据分析。
11.1 结合merge操作
有时我们需要将分组结果与原始数据合并:
# 创建原始数据
original_data = pd.DataFrame({
    'date': pd.date_range(start='2023-01-01', end='2023-12-31', freq='D'),
    'value': np.random.randn(365)
})

# 计算每月平均值
monthly_avg = original_data.groupby(original_data['date'].dt.month)['value'].mean().reset_index()
monthly_avg.columns = ['month', 'monthly_avg']

# 将月平均值合并回原始数据
result = pd.merge(original_data, monthly_avg, left_on=original_data['date'].dt.month, right_on='month')

print(result.head())
这个示例展示了如何计算每月平均值,然后将结果合并回原始数据集。
11.2 结合pivot_table
pivot_table是另一个强大的数据重塑工具,可以与GroupBy结合使用:
# 创建多维数据
multi_dim_data = pd.DataFrame({
    'date': pd.date_range(start='2023-01-01', end='2023-12-31', freq='D'),
    'product': np.random.choice(['A', 'B', 'C'], size=365),
    'region': np.random.choice(['North', 'South', 'East', 'West'], size=365),
    'sales': np.random.randint(100, 1000, size=365)
})

# 使用pivot_table按月份和产品分析销售
monthly_product_sales = pd.pivot_table(multi_dim_data,
                                       values='sales',
                                       index=[multi_dim_data['date'].dt.month],
                                       columns=['product'],
                                       aggfunc='sum')

print(monthly_product_sales)
这个例子展示了如何使用pivot_table来创建一个按月份和产品类型的销售汇总表。
12. 高级时间序列分析
GroupBy按月份分组的功能在更复杂的时间序列分析中也有重要应用。
12.1 移动相关性分析
# 创建两个相关的时间序列
date_rng = pd.date_range(start='2020-01-01', end='2023-12-31', freq='D')
df_corr = pd.DataFrame({
    'date': date_rng,
    'series1': np.random.randn(len(date_rng)).cumsum(),
    'series2': np.random.randn(len(date_rng)).cumsum()
})

# 计算每月的相关性
monthly_corr = df_corr.groupby(df_corr['date'].dt.to_period('M')).apply(lambda x: x['series1'].corr(x['series2']))

print(monthly_corr)
这个示例展示了如何计算两个时间序列在每个月内的相关性。
12.2 周期性分析
# 创建具有周期性的数据
date_rng = pd.date_range(start='2020-01-01', end='2023-12-31', freq='D')
df_periodic = pd.DataFrame({
    'date': date_rng,
    'value': np.sin(np.arange(len(date_rng)) * 2 * np.pi / 365) + np.random.randn(len(date_rng)) * 0.1
})

# 计算每月的周期性指标
monthly_periodicity = df_periodic.groupby(df_periodic['date'].dt.month).apply(lambda x: np.fft.fft(x['value']).real.mean())

print(monthly_periodicity)
这个例子展示了如何使用傅里叶变换来分析每个月的周期性特征。
13. 数据质量检查
在进行分组分析之前,确保数据质量是非常重要的。
13.1 检查异常值
# 创建包含异常值的数据
df_outliers = pd.DataFrame({
    'date': pd.date_range(start='2023-01-01', end='2023-12-31', freq='D'),
    'value': np.random.randn(365)
})
df_outliers.loc[df_outliers.index[180], 'value'] = 100  # 添加一个异常值

# 使用IQR方法检测每月的异常值
def detect_outliers(group):
    Q1 = group.quantile(0.25)
    Q3 = group.quantile(0.75)
    IQR = Q3 - Q1
    lower_bound = Q1 - 1.5 * IQR
    upper_bound = Q3 + 1.5 * IQR
    return ((group < lower_bound) | (group > upper_bound)).sum()

monthly_outliers = df_outliers.groupby(df_outliers['date'].dt.month)['value'].apply(detect_outliers)

print(monthly_outliers)
这个示例展示了如何使用四分位距(IQR)方法来检测每个月的异常值数量。
13.2 检查缺失数据
# 创建包含缺失值的数据
df_missing = pd.DataFrame({
    'date': pd.date_range(start='2023-01-01', end='2023-12-31', freq='D'),
    'value': np.random.randn(365)
})
df_missing.loc[df_missing.index[::10], 'value'] = np.nan  # 每10天添加一个缺失值

# 检查每月的缺失值比例
monthly_missing_ratio = df_missing.groupby(df_missing['date'].dt.month)['value'].apply(lambda x: x.isnull().mean())

print(monthly_missing_ratio)
这个例子展示了如何计算每个月数据的缺失值比例。
结论
通过本文,我们深入探讨了Pandas中GroupBy按月份分组的各种应用和技巧。从基本的分组操作到高级的时间序列分析,我们涵盖了广泛的主题,包括数据处理、可视化、性能优化和实际应用案例。这些技能对于处理时间序列数据和进行月度分析至关重要。
掌握这些技巧将使您能够更有效地处理和分析时间相关的数据,无论是在金融分析、销售预测、还是其他需要按月份进行数据聚合和比较的领域。记住,实践是掌握这些技能的关键。尝试将这些方法应用到您自己的数据集中,并探索更多Pandas提供的强大功能。
随着数据分析领域的不断发展,保持学习和更新知识是非常重要的。希望本文能为您的数据分析之旅提供有价值的指导和启发。
 极客教程
极客教程