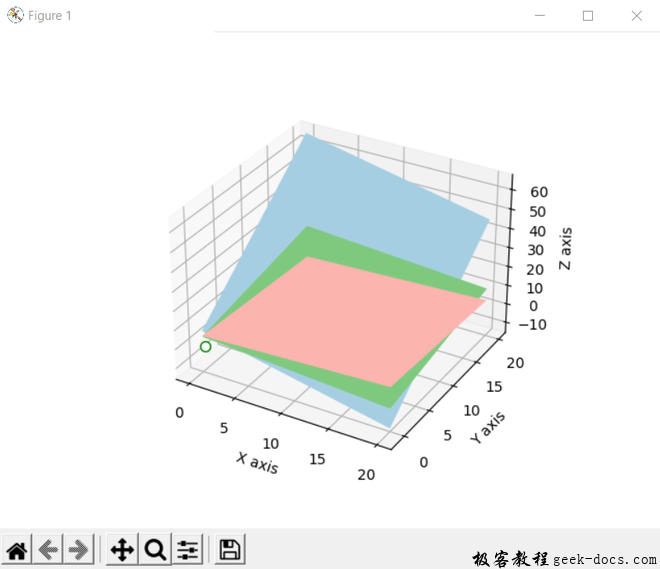
在Python中求解线性方程并返回3D图形
在这篇文章中,我们将通过使用Python求解线性方程来制作3D图形。
在Python中求解线性方程
这里我们将创建一个不同的变量,用于向线性方程赋值,然后通过使用linalg.solve()方法计算出数值。
# Python program to solve linear
# equation and return 3-d graph

# IMport the libraries
import numpy as np

x1, y1, z1, w1 = 1, -2, 3, 9

# Take the input for equation-2
x2, y2, z2, w2 = -1, 3, -1, -6

# Take the input for equation-3
x3, y3, z3, w3 = 2, -5, 5, 17

# Create an array for LHS variables
LHS = np.array([[x1, y1, z1],
                [x2, y2, z2],
                [x3, y3, z3]])

# Create another array for RHS variables
RHS = np.array([w1, w2, w3])

# Apply linear algebra on any numpy
# array created and printing the output
sol = np.linalg.solve(LHS, RHS)
print(sol)
输出:
[ 1. -1. 2.]
解决线性方程并返回三维图形
在得到线性方程后,我们将使用matplotlib绘制三维图形。我们使用figure()函数创建三维图形。此外,我们使用matplotlib库中的figure模块add_subplot()方法,将坐标轴添加到图形中,作为子图排列的一部分。
import matplotlib.pyplot as plt
from matplotlib import cm

# Returns number spaces evenly w.r.t
# interval
x_axis, y_axis = np.linspace(0, 20, 10),
np.linspace(0, 20, 10)

# Create a rectangular grid out of
# two given one-dimensional arrays
X, Y = np.meshgrid(x_axis, y_axis)

# Make a rectangular grid
# 3-dimensional by calculating z1, z2, z3
Z1 = (w1-x1*X-y1*Y)/z1
Z2 = (w2-x2*X-y2*Y)/z2
Z3 = (w3+X-Y)/z3

# Create 3D graphics and add
# an add an axes to the figure
fig = plt.figure()
ax = fig.add_subplot(111, projection='3d')

# Create a 3D Surface Plot
ax.plot_surface(X, Y, Z1, alpha=1,
                cmap=cm.Accent,
                rstride=100, cstride=100)
ax.plot_surface(X, Y, Z2, alpha=1,
                cmap=cm.Paired,
                rstride=100, cstride=100)
ax.plot_surface(X, Y, Z3, alpha=1,
                cmap=cm.Pastel1,
                rstride=100, cstride=100)

# Draw points and make lines
ax.plot((sol[0],), (sol[1],), (sol[2],),
        lw=2, c='k', marker='o',
        markersize=7, markeredgecolor='g',
        markerfacecolor='white')

# Set the label for x-axis, y-axis and
# z-axis
ax.set_xlabel('X axis')
ax.set_ylabel('Y axis')
ax.set_zlabel('Z axis')

# Display all figures
plt.show()
输出:

 极客教程
极客教程