NumPy随机正态分布:全面解析与应用
NumPy是Python中用于科学计算的核心库,其中的random模块提供了强大的随机数生成功能。本文将深入探讨NumPy中的random.normal函数,这是一个用于生成符合正态分布(也称为高斯分布)的随机数的重要工具。我们将详细介绍其原理、用法以及在各种场景中的应用,并提供丰富的示例代码来帮助读者更好地理解和使用这一功能。
1. 正态分布简介
正态分布是统计学和概率论中最重要的概率分布之一。它呈钟形曲线,对称分布在平均值周围。正态分布由两个参数决定:均值(μ)和标准差(σ)。
在NumPy中,我们可以使用random.normal函数来生成符合正态分布的随机数。下面是一个简单的示例:
import numpy as np

# 生成10个均值为0,标准差为1的正态分布随机数
random_numbers = np.random.normal(loc=0, scale=1, size=10)
print("Generated random numbers from numpyarray.com:", random_numbers)
Output:

在这个例子中,我们生成了10个符合标准正态分布(均值为0,标准差为1)的随机数。loc参数指定均值,scale参数指定标准差,size参数指定要生成的随机数数量。
2. random.normal函数详解
np.random.normal函数的完整签名如下:
numpy.random.normal(loc=0.0, scale=1.0, size=None)
参数说明:
– loc:float或array_like,表示分布的均值(默认为0.0)
– scale:float或array_like,表示分布的标准差(默认为1.0)
– size:int或tuple of ints,表示输出数组的形状(默认为None,返回单个值)
让我们通过一些示例来深入了解这个函数的使用:
import numpy as np

# 生成单个随机数
single_number = np.random.normal()
print("Single random number from numpyarray.com:", single_number)

# 生成5x5的随机数数组
random_array = np.random.normal(size=(5, 5))
print("5x5 random array from numpyarray.com:\n", random_array)

# 指定均值和标准差
custom_distribution = np.random.normal(loc=10, scale=2, size=10)
print("Custom distribution from numpyarray.com:", custom_distribution)
Output:

这个示例展示了如何生成单个随机数、二维随机数数组,以及如何自定义均值和标准差。
3. 设置随机种子
为了确保结果的可重复性,我们可以使用np.random.seed()函数设置随机种子:
import numpy as np

# 设置随机种子
np.random.seed(42)

# 生成随机数
random_numbers = np.random.normal(size=5)
print("Random numbers with seed from numpyarray.com:", random_numbers)

# 重新设置相同的种子
np.random.seed(42)

# 再次生成随机数
same_random_numbers = np.random.normal(size=5)
print("Same random numbers from numpyarray.com:", same_random_numbers)
Output:

这个例子展示了如何使用随机种子来生成可重复的随机数序列。
4. 生成特定形状的随机数组
np.random.normal函数的size参数非常灵活,可以用来生成各种形状的随机数组:
import numpy as np

# 生成1D数组
array_1d = np.random.normal(size=5)
print("1D array from numpyarray.com:", array_1d)

# 生成2D数组
array_2d = np.random.normal(size=(3, 4))
print("2D array from numpyarray.com:\n", array_2d)

# 生成3D数组
array_3d = np.random.normal(size=(2, 3, 2))
print("3D array from numpyarray.com:\n", array_3d)
Output:
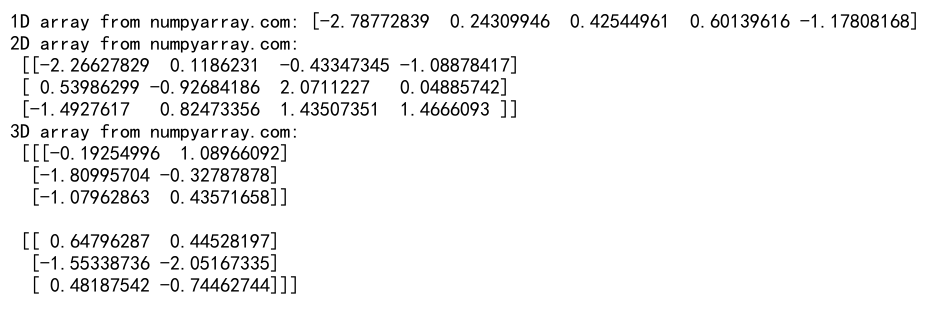
这个示例展示了如何生成不同维度的随机数组。
5. 使用广播机制
NumPy的广播机制允许我们为不同的维度指定不同的均值和标准差:
import numpy as np

# 为每一列指定不同的均值
means = np.array([0, 1, 2])
random_array = np.random.normal(loc=means, scale=1, size=(4, 3))
print("Array with different means for each column from numpyarray.com:\n", random_array)

# 为每一行指定不同的标准差
stds = np.array([1, 2, 3, 4])[:, np.newaxis]
random_array = np.random.normal(loc=0, scale=stds, size=(4, 3))
print("Array with different stds for each row from numpyarray.com:\n", random_array)
Output:
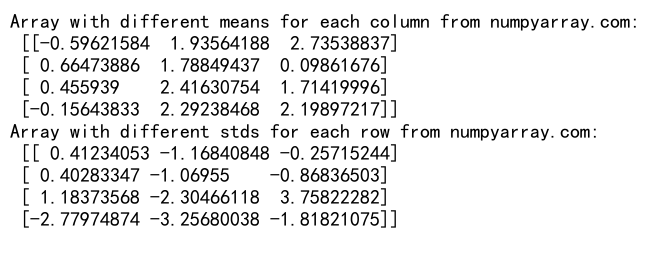
这个例子展示了如何使用广播机制为数组的不同部分指定不同的参数。
6. 生成整数随机数
虽然np.random.normal生成的是浮点数,但我们可以通过取整来获得整数随机数:
import numpy as np

# 生成均值为100,标准差为10的整数随机数
integer_random_numbers = np.round(np.random.normal(loc=100, scale=10, size=10)).astype(int)
print("Integer random numbers from numpyarray.com:", integer_random_numbers)
Output:

这个示例展示了如何生成近似服从正态分布的整数随机数。
7. 可视化正态分布
虽然本文不包含图片,但我们可以提供一个生成直方图数据的示例,这些数据可以用于可视化正态分布:
import numpy as np

# 生成大量随机数
random_numbers = np.random.normal(loc=0, scale=1, size=10000)

# 计算直方图数据
hist, bin_edges = np.histogram(random_numbers, bins=50)

print("Histogram data from numpyarray.com:")
print("Counts:", hist)
print("Bin edges:", bin_edges)
Output:
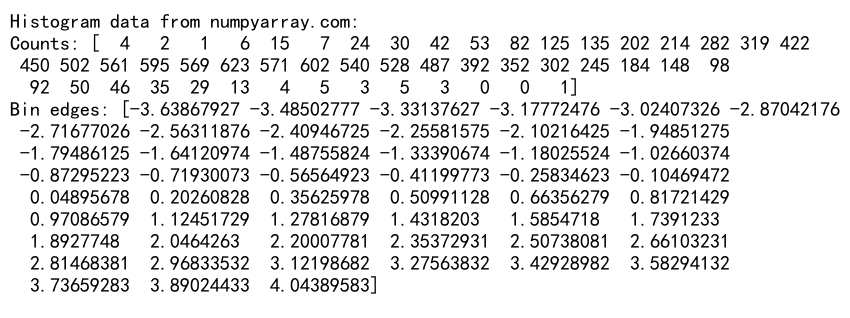
这个例子生成了可用于绘制直方图的数据,可以帮助我们理解生成的随机数的分布情况。
8. 正态分布在数据生成中的应用
正态分布在模拟真实世界数据时非常有用。以下是一个模拟学生考试成绩的例子:
import numpy as np

# 模拟100名学生的考试成绩,平均分75分,标准差10分
scores = np.random.normal(loc=75, scale=10, size=100)

# 将分数限制在0-100之间
scores = np.clip(scores, 0, 100)

print("Simulated exam scores from numpyarray.com:", scores)
Output:
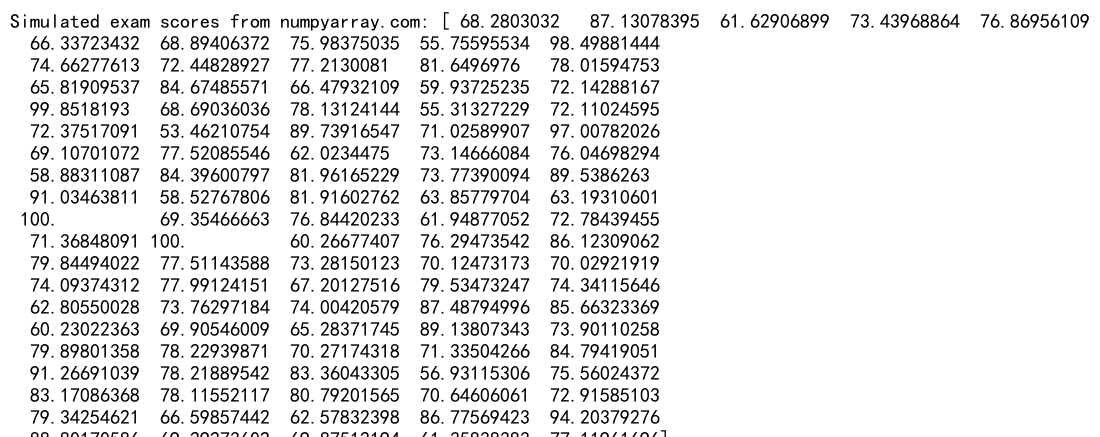
这个示例展示了如何使用正态分布来模拟真实世界的数据。
9. 多维正态分布
NumPy还支持生成多维正态分布的随机数:
import numpy as np

# 定义均值向量和协方差矩阵
mean = [0, 1]
cov = [[1, 0.5], [0.5, 2]]

# 生成二维正态分布的随机数
multivariate_normal = np.random.multivariate_normal(mean, cov, size=5)
print("Multivariate normal distribution from numpyarray.com:\n", multivariate_normal)
Output:
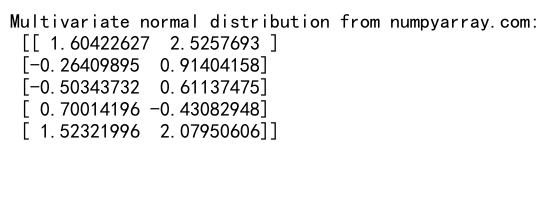
这个例子展示了如何生成多维正态分布的随机数。
10. 正态分布在机器学习中的应用
正态分布在机器学习中有广泛的应用,例如在初始化神经网络权重时:
import numpy as np

# 模拟神经网络层的权重初始化
input_size = 10
output_size = 5

# 使用正态分布初始化权重,均值为0,标准差为1/sqrt(input_size)
weights = np.random.normal(loc=0, scale=1/np.sqrt(input_size), size=(input_size, output_size))

print("Neural network weights initialized from numpyarray.com:\n", weights)
Output:
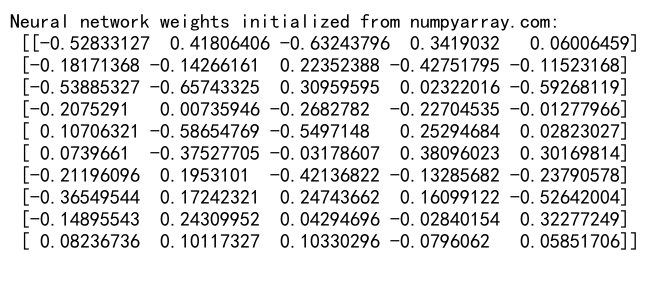
这个示例展示了如何使用正态分布来初始化神经网络的权重。
11. 生成相关的随机变量
我们可以使用正态分布来生成相关的随机变量:
import numpy as np

# 生成两个相关的随机变量
n = 1000
correlation = 0.7

x = np.random.normal(size=n)
y = correlation * x + np.sqrt(1 - correlation**2) * np.random.normal(size=n)

print("Correlated random variables from numpyarray.com:")
print("X:", x[:5])
print("Y:", y[:5])
Output:

这个例子展示了如何生成两个具有指定相关性的随机变量。
12. 正态分布在统计推断中的应用
正态分布在统计推断中扮演着重要角色,例如在计算置信区间时:
import numpy as np

# 模拟实验数据
sample_size = 100
sample_mean = np.mean(np.random.normal(loc=10, scale=2, size=sample_size))
sample_std = np.std(np.random.normal(loc=10, scale=2, size=sample_size))

# 计算95%置信区间
confidence_level = 0.95
degrees_of_freedom = sample_size - 1
t_value = np.abs(np.random.standard_t(degrees_of_freedom, size=1))

margin_of_error = t_value * (sample_std / np.sqrt(sample_size))
confidence_interval = (sample_mean - margin_of_error, sample_mean + margin_of_error)

print(f"{confidence_level*100}% Confidence Interval from numpyarray.com:", confidence_interval)
Output:

这个示例展示了如何使用正态分布来计算样本均值的置信区间。
总结
本文深入探讨了NumPy中random.normal函数的使用方法和应用场景。我们从基本概念出发,介绍了如何生成符合正态分布的随机数,如何设置随机种子以确保结果可重复,以及如何生成不同形状和维度的随机数组。我们还讨论了正态分布在数据模拟、机器学习和统计推断等领域的应用。
通过丰富的示例代码,我们展示了random.normal函数的灵活性和强大功能。这些示例涵盖了从简单的随机数生成到复杂的多维正态分布,以及在实际问题中的应用,如模拟考试成绩、初始化神经网络权重等。
正态分布是统计学和数据科学中最重要的概念之一,掌握NumPy中的random.normal函数对于数据分析、机器学习和科学计算等领域的工作者来说至关重要。希望本文能够帮助读者更好地理解和应用这一强大的工具,为他们的数据科学之旅提供有力支持。
 极客教程
极客教程