NumPy 插值
在数据处理和科学计算中,经常会遇到需要对数据进行插值的情况。插值是一种通过已知数据点推断未知数据点的方法,常用于填补缺失值、平滑数据、估计函数值等。在Python中,NumPy库提供了丰富的插值函数,可以方便地进行插值操作。
一维插值
线性插值
线性插值是最简单的插值方法,通过已知数据点之间的线性关系来估计未知数据点的值。在NumPy中,可以使用numpy.interp()函数进行线性插值。
import numpy as np

x = np.array([1, 2, 3, 4, 5])
y = np.array([2, 3, 5, 7, 11])

x_new = np.array([1.5, 2.5, 3.5, 4.5])
y_new = np.interp(x_new, x, y)

print(y_new)
Output:

多项式插值
多项式插值通过已知数据点构建一个多项式函数来估计未知数据点的值。在NumPy中,可以使用numpy.polyfit()函数进行多项式插值。
import numpy as np

x = np.array([1, 2, 3, 4, 5])
y = np.array([2, 3, 5, 7, 11])

coefficients = np.polyfit(x, y, 2)
poly = np.poly1d(coefficients)

x_new = np.array([1.5, 2.5, 3.5, 4.5])
y_new = poly(x_new)

print(y_new)
Output:

样条插值
样条插值是一种平滑的插值方法,通过在每个数据点处拟合一个低阶多项式来估计未知数据点的值。在NumPy中,可以使用scipy.interpolate模块进行样条插值。
import numpy as np
from scipy.interpolate import CubicSpline

x = np.array([1, 2, 3, 4, 5])
y = np.array([2, 3, 5, 7, 11])

cs = CubicSpline(x, y)
x_new = np.array([1.5, 2.5, 3.5, 4.5])
y_new = cs(x_new)

print(y_new)
Output:

二维插值
线性插值
在二维数据中进行线性插值时,可以使用scipy.interpolate.interp2d函数。
import numpy as np
from scipy.interpolate import interp2d

x = np.array([1, 2, 3, 4, 5])
y = np.array([1, 2, 3, 4, 5])
z = np.array([[1, 2, 3, 4, 5],
              [2, 3, 4, 5, 6],
              [3, 4, 5, 6, 7],
              [4, 5, 6, 7, 8],
              [5, 6, 7, 8, 9]])

f = interp2d(x, y, z, kind='linear')
x_new = np.array([1.5, 2.5, 3.5, 4.5])
y_new = np.array([1.5, 2.5, 3.5, 4.5])
z_new = f(x_new, y_new)

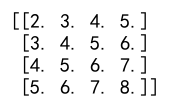
print(z_new)
二维样条插值
在二维数据中进行样条插值时,可以使用scipy.interpolate.RectBivariateSpline函数。
import numpy as np
from scipy.interpolate import RectBivariateSpline

x = np.array([1, 2, 3, 4, 5])
y = np.array([1, 2, 3, 4, 5])
z = np.array([[1, 2, 3, 4, 5],
              [2, 3, 4, 5, 6],
              [3, 4, 5, 6, 7],
              [4, 5, 6, 7, 8],
              [5, 6, 7, 8, 9]])

f = RectBivariateSpline(x, y, z)
x_new = np.array([1.5, 2.5, 3.5, 4.5])
y_new = np.array([1.5, 2.5, 3.5, 4.5])
z_new = f(x_new, y_new)

print(z_new)
Output:

三维插值
三维样条插值
在三维数据中进行样条插值时,可以使用scipy.interpolate.RegularGridInterpolator函数。
import numpy as np
from scipy.interpolate import RegularGridInterpolator

x = np.array([1, 2, 3, 4, 5])
y = np.array([1, 2, 3, 4, 5])
z = np.array([1, 2, 3, 4, 5])
data = np.random.rand(5, 5, 5)

f = RegularGridInterpolator((x, y, z), data)
points = np.array([[1.5, 2.5, 3.5, 4.5],
                    [1.5, 2.5, 3.5, 4.5],
                    [1.5, 2.5, 3.5, 4.5]])
values = f(points)

print(values)
总结
本文介绍了NumPy库中的插值方法,包括一维插值、二维插值和三维插值。通过线性插值、多项式插值和样条插值等方法,可以方便地对数据进行插值操作,从而更好地处理和分析数据。在实际应用中,根据数据的特点和需求选择合适的插值方法是非常重要的。
 极客教程
极客教程