R语言 设置ggplot2绘图轴的原点为零
在这篇文章中,我们将研究如何借助R编程语言的一些功能,将gplot2绘图轴的原点设置为零的方法。
在这种将ggpot2绘图轴的原点设置为零的方法中,用户首先需要在工作的R控制台中安装并导入ggplot2软件包,然后与绘图一起调用scale_x_continuous()和scale_y_continuous()函数,并加入所需的参数,这将在R编程语言中为ggplot2绘图轴的原点添加零。
scale_x_continuous()和scale_y_continuous()函数 用于设置连续位置标度(x和y)。
语法
scale_x_continuous(…, expand = waiver()
scale_y_continuous(…, expand = waiver())
参数
- …:常见的连续量表参数:名称、断点、标签、na.value、极限和trans。
- Expand:一个长度为2的数字向量,给出乘法和加法扩展常数。
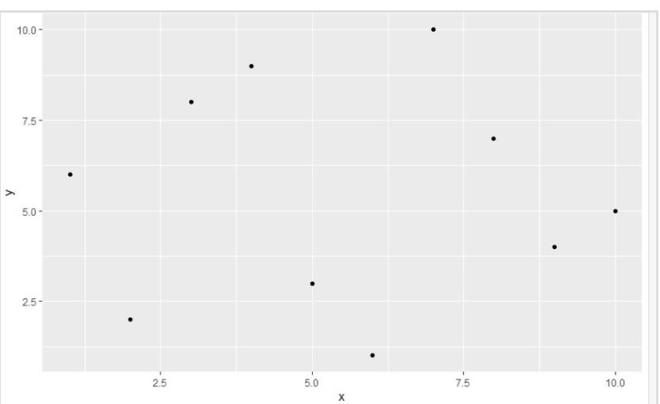
让我们先看一下初始图,这样就可以看出区别。
例子: 初始图
library(ggplot2)

gfg < - data.frame(x=c(4, 9, 5, 6, 10, 2, 3, 7, 8, 1),
                   y=c(9, 4, 3, 1, 5, 2, 8, 10, 7, 6))

gfg_plot < - ggplot(gfg, aes(x, y)) + geom_point()

gfg_plot
输出
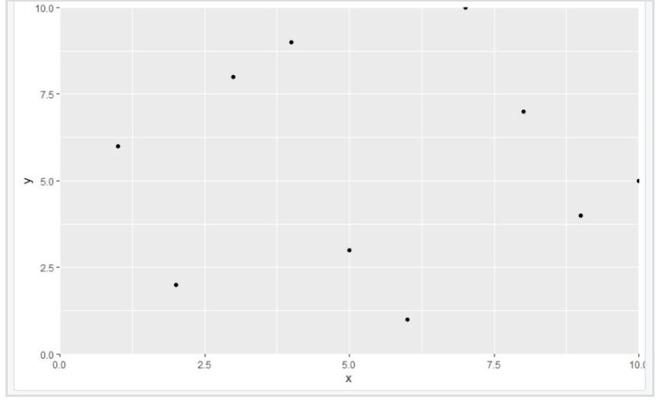
现在,让我们用上面描述的方法在原点上加零。
例子: 最终图
library(ggplot2)

gfg < - data.frame(x=c(4, 9, 5, 6, 10, 2, 3, 7, 8, 1),
                   y=c(9, 4, 3, 1, 5, 2, 8, 10, 7, 6))

gfg_plot < - ggplot(gfg, aes(x, y)) + geom_point()+
scale_x_continuous(expand=c(0, 0), limits=c(0, 10)) +
scale_y_continuous(expand=c(0, 0), limits=c(0, 10))

gfg_plot
输出
 极客教程
极客教程
