R语言 散点图
散点图是一组点状的点来代表横轴和纵轴上的各个数据。一个图形,其中两个变量的值沿X轴和Y轴绘制,所产生的点的模式显示了它们之间的相关性。
R语言 散点图
我们可以使用 plot() 函数 在R编程语言中 创建 散点图 。
语法: plot(x, y, main, xlab, ylab, xlim, ylim, axes)
参数
- x: 该参数设置水平坐标。
- y :此参数设置垂直坐标。
- xlab: 该参数是水平轴的标签。
- ylab : 这个参数是垂直轴的标签。
- main: 该参数main是图表的标题。
- xlim: 该参数用于绘制x的数值。
- ylim :该参数用于绘制y的数值。
- axes: 该参数表示是否应在图表上绘制两个轴。
简单的散点图
为了创建散点图。
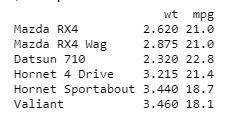
- 我们使用数据集 “mtcars”。
- 使用mtcars中的列 “wt “和 “mpg”。
例子
input <- mtcars[, c('wt', 'mpg')]
print(head(input))
输出
创建一个散点图
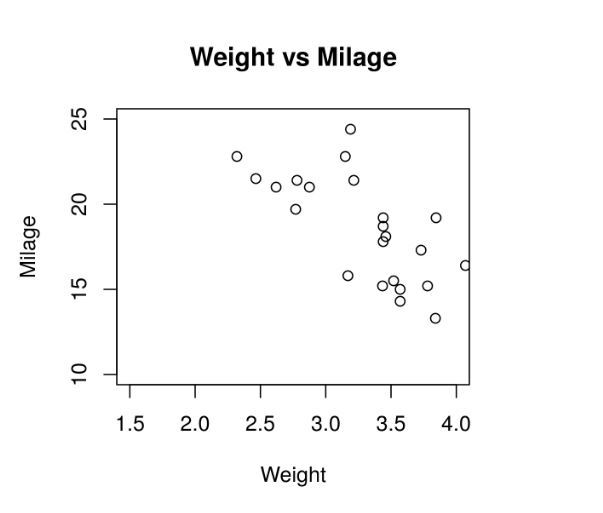
为了创建一个散点图。
- 我们正在使用所需的参数来绘制图表。
- 其中’xlab’描述X轴,’ylab’描述Y轴。
例子
# Get the input values.
input <- mtcars[, c('wt', 'mpg')]

# Plot the chart for cars with
# weight between 1.5 to 4 and
# mileage between 10 and 25.
plot(x = inputwt, y = inputmpg,
    xlab = "Weight",
    ylab = "Milage",
    xlim = c(1.5, 4),
    ylim = c(10, 25),
    main = "Weight vs Milage"
)
输出
散点图矩阵
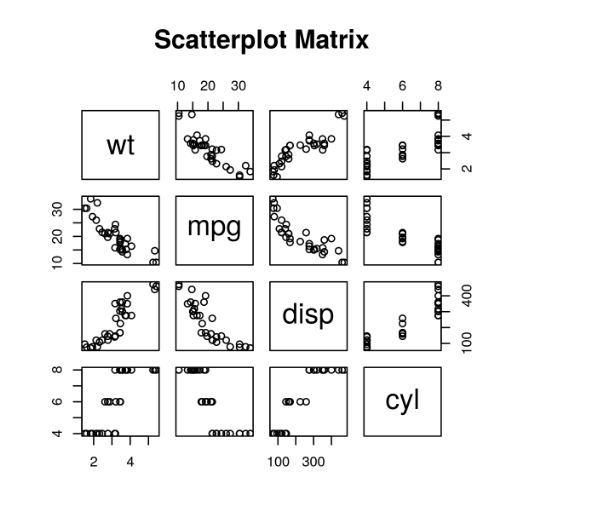
当我们有两个或更多的变量,并且我们想在一个变量和其他变量之间进行关联,所以我们使用散点图矩阵。
pairs() 函数用于创建散点图的矩阵。
语法: pair(formula, data)
参数
- formula: 这个参数代表在pair中使用的一系列变量。
- data :该参数代表变量将来自的数据集。
例子
# Plot the matrices between
# 4 variables giving 12 plots.

# One variable with 3 others
# and total 4 variables.
pairs(~wt + mpg + disp + cyl, data = mtcars,
    main = "Scatterplot Matrix")
输出
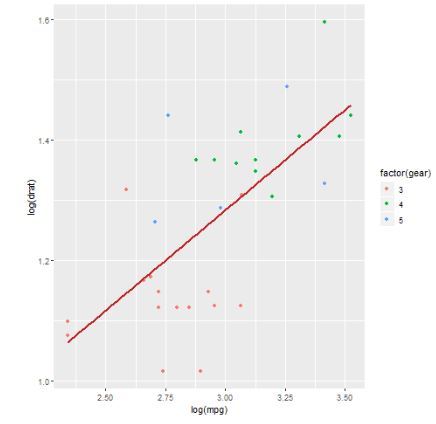
带有拟合值的散点图
为了创建散点图。
- 我们使用ggplot2包提供的ggplot()和geom_point()函数来创建散点图。
- 此外,我们还使用了mtcars中的 “wt “和 “mpg “列。
例子
# Loading ggplot2 package
library(ggplot2)

# Creating scatterplot with fitted values.
# An additional function stst_smooth
# is used for linear regression.
ggplot(mtcars, aes(x = log(mpg), y = log(drat))) +
        geom_point(aes(color = factor(gear))) +
        stat_smooth(method = "lm",
        col = "#C42126", se = FALSE, size = 1
)
输出
添加带有动态名称的标题
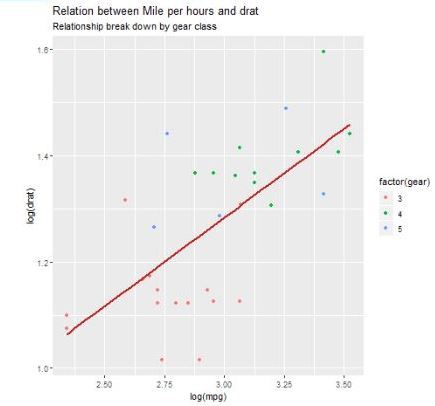
为了创建散点图,添加一个副标题。
- 我们使用额外的函数,在ggplot中,我们添加数据集 “mtcars”,并加入’ais’,’geom_point’。
- 使用标题、说明、副标题。
例子
# Loading ggplot2 package
library(ggplot2)

# Creating scatterplot with fitted values.
# An additional function stst_smooth
# is used for linear regression.
new_graph<-ggplot(mtcars, aes(x = log(mpg),
                              y = log(drat))) +
                    geom_point(aes(color = factor(gear))) +
                    stat_smooth(method = "lm",
                                col = "#C42126",
                    se = FALSE, size = 1)

# in above example lm is used for linear regression
# and se stands for standard error.
# Adding title with dynamic name
new_graph + labs(
        title = "Relation between Mile per hours and drat",
        subtitle = "Relationship break down by gear class",
        caption = "Authors own computation"
)
输出
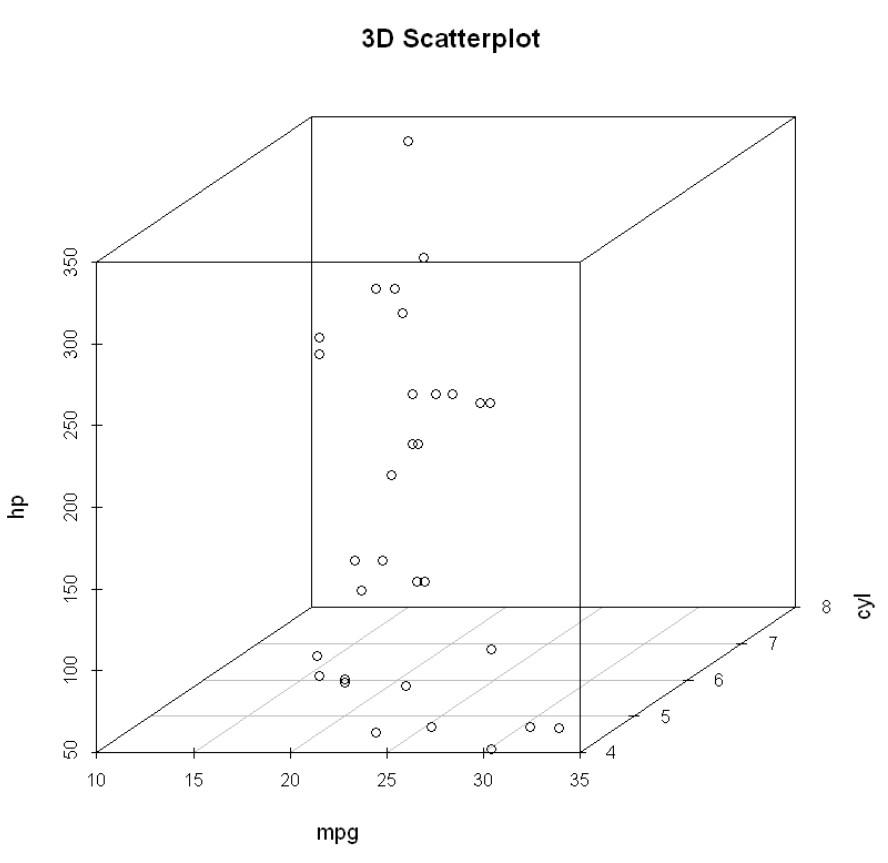
三维散点图
这里我们将使用scatterplot3D包来创建3D散点图,这个包可以使用scatterplot3d()方法绘制3D散点图。
# 3D Scatterplot
library(scatterplot3d)
attach(mtcars)

scatterplot3d(mpg, cyl, hp,
              main = "3D Scatterplot")
输出
 极客教程
极客教程