R语言 图表和图形
R语言 主要用于统计和数据分析的目的,在软件中以图形表示数据。为了用图形表示这些数据,R语言中使用了图表和图形。
R语言 – 图形
R语言中有数百种图表和图形。例如,柱状图、箱形图、马赛克图、点图、共轭图、直方图、饼图、散点图等。
R-图表的类型
- 柱状图或条形图
- 饼图或饼状图
- 柱状图
- 散点图
- 箱形图
柱状图或条形图
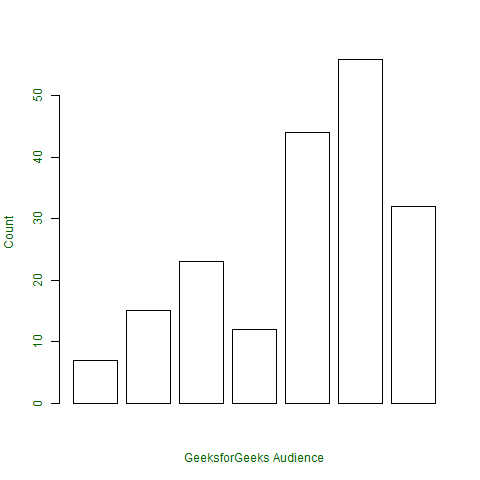
R语言中的柱状图或条形图用于将数据向量中的值表示为条形的高度。传递给函数的数据向量在图表的Y轴上表示。通过使用 table() 函数而不是数据向量,条形图可以表现得像直方图。
语法: barplot(data, xlab, ylab)
其中
- data 是要在y轴上表示的数据向量
- xlab 是给X轴的标签
- ylab 是给Y轴的标签。
注: 要了解 barplot() 函数中更多的可选参数,请在R控制台使用以下命令。
help("barplot")
例子
# defining vector
x <- c(7, 15, 23, 12, 44, 56, 32)

# output to be present as PNG file
png(file = "barplot.png")

# plotting vector
barplot(x, xlab = "GeeksforGeeks Audience",
        ylab = "Count", col = "white",
        col.axis = "darkgreen",
        col.lab = "darkgreen")

# saving the file
dev.off()
输出
饼图或饼状图
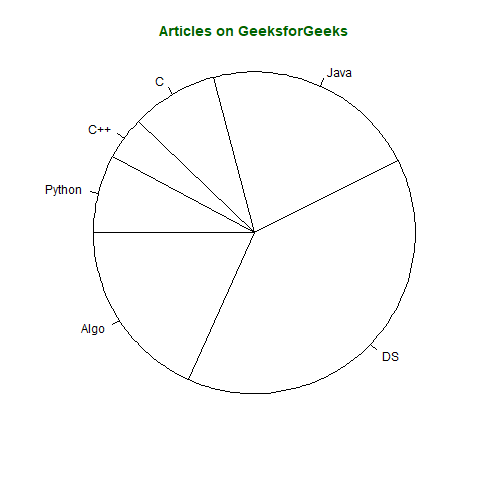
饼图是一个圆形的图表,根据提供的数据比例分为不同的段。饼的总价值是100,各段告诉了整个饼的分数。它是另一种以图形形式表示统计数据的方法, pie() 函数被用来执行同样的操作。
语法: pie(x, labels, col, main, radius)
其中
- x 是数据向量
- labels 显示给各片的名称
- col 在给定参数的切片中填入颜色
- main 显示饼图的标题名称
- radius 表示饼图的半径。它可以在-1到+1之间
注意: 要了解 pie() 函数中更多的可选参数,请在R控制台使用下面的命令。
help("pie")
例子
假设向量x表示GeeksforGeeks门户网站上的文章数量,其类别为names(x)
# defining vector x with number of articles
x <- c(210, 450, 250, 100, 50, 90)

# defining labels for each value in x
names(x) <- c("Algo", "DS", "Java", "C", "C++", "Python")

# output to be present as PNG file
png(file = "piechart.png")

# creating pie chart
pie(x, labels = names(x), col = "white",
main = "Articles on GeeksforGeeks", radius = -1,
col.main = "darkgreen")

# saving the file
dev.off()
输出
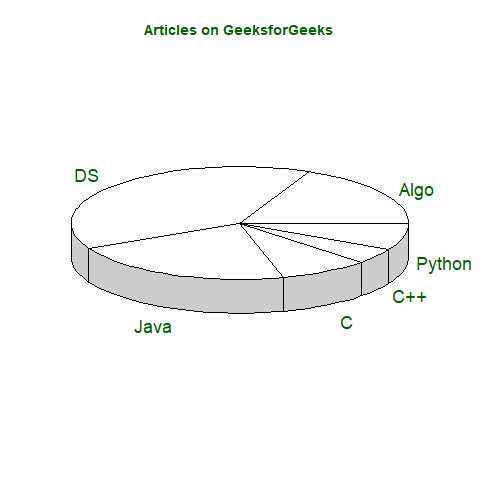
三维饼状图也可以通过以下语法在R中创建,但需要 plotrix 库。
语法: pie3D(x, labels, radius, main)
注意: 要了解pie3D()函数中更多的可选参数,请在R控制台使用以下命令。
help("pie3D")
例子
# importing library plotrix for pie3D()
library(plotrix)

# defining vector x with number of articles
x <- c(210, 450, 250, 100, 50, 90)

# defining labels for each value in x
names(x) <- c("Algo", "DS", "Java", "C", "C++", "Python")

# output to be present as PNG file
png(file = "piechart3d.png")

# creating pie chart
pie3D(x, labels = names(x), col = "white",
main = "Articles on GeeksforGeeks",
labelcol = "darkgreen", col.main = "darkgreen")

# saving the file
dev.off()
输出
直方图
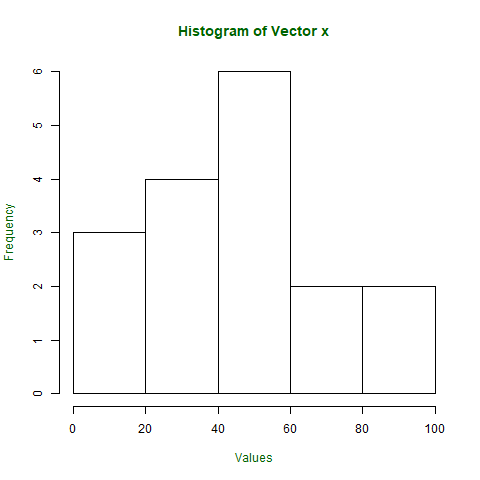
直方图是一种图形表示法,用于创建一个用条形表示向量中分组数据频率的图形。直方图与柱状图相同,但它们之间唯一的区别是直方图表示分组数据的频率而不是数据本身。
语法: hist(x, col, border, main, xlab, ylab)
其中
- x 是数据向量
- col 指定要填充的条形图的颜色
- border 指定条形图边框的颜色
- main 指定直方图的标题名称
- xlab 指定X轴的标签
- ylab 指定Y轴的标签
注意: 要了解 hist() 函数中更多的可选参数,请在R控制台使用以下命令。
help("hist")
例子
# defining vector
x <- c(21, 23, 56, 90, 20, 7, 94, 12,
    57, 76, 69, 45, 34, 32, 49, 55, 57)

# output to be present as PNG file
png(file = "hist.png")

# hist(x, main = "Histogram of Vector x",
        xlab = "Values",
        col.lab = "darkgreen",
        col.main = "darkgreen")

# saving the file
dev.off()
输出
散点图
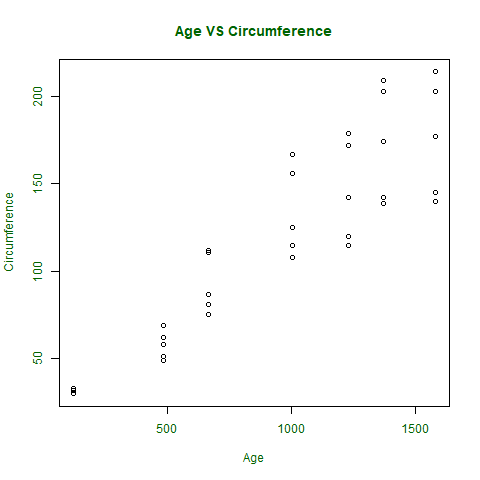
散点图是另一种类型的图形表示,用于绘制显示两个数据向量之间关系的点。其中一个数据向量在X轴上表示,另一个在Y轴上表示。
语法: plot(x, y, type, xlab, ylab, main)
其中
- x 是在x轴上表示的数据向量
- y 是在y轴上表示的数据向量
- type 指定要绘制的图的类型。例如,”l “表示线,”p “表示点,”s “表示阶梯,等等。
- xlab 指定X轴的标签。
- ylab 指定了y轴的标签。
- main 指定图形的标题名称
注: 要了解 plot() 函数中更多的可选参数,请在R控制台使用以下命令。
help("plot")
例子
# taking input from dataset Orange already
# present in R
orange <- Orange[, c('age', 'circumference')]

# output to be present as PNG file
png(file = "plot.png")

# plotting
plot(x = orangeage, y = orangecircumference, xlab = "Age",
ylab = "Circumference", main = "Age VS Circumference",
col.lab = "darkgreen", col.main = "darkgreen",
col.axis = "darkgreen")

# saving the file
dev.off()
输出
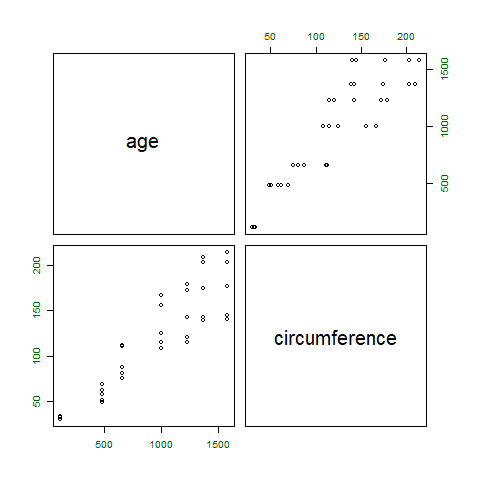
如果必须绘制散点图以显示2个或更多向量之间的关系,或绘制向量之间的散点图矩阵,那么就可以使用 pair() 函数来满足标准。
语法: pair(~公式, 数据)
其中
- ~formula 是数学公式,如~a+b+c
- data 是数据集的形式,其中数据取自于公式。
注意: 要了解pair()函数中更多的可选参数,请在R控制台使用下面的命令。
help("pairs")
例子 :
# output to be present as PNG file
png(file = "plotmatrix.png")

# plotting scatterplot matrix
# using dataset Orange
pairs(~age + circumference, data = Orange,
col.axis = "darkgreen")

# saving the file
dev.off()
输出
箱形图
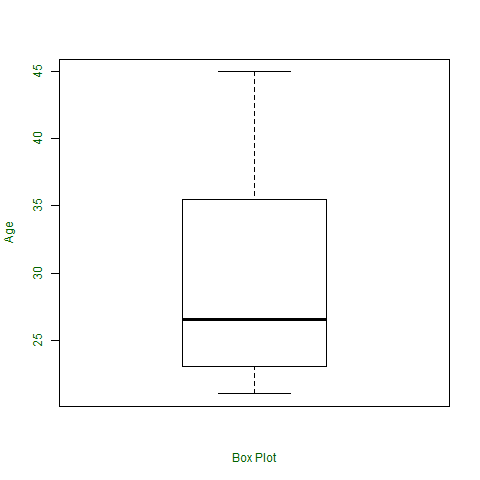
箱形图显示了数据在数据向量中的分布情况。它在图中表示五个值,即数据向量的最小值、第一四分位数、第二四分位数(中位数)、第三四分位数和最大值。
语法: boxplot(x, xlab, ylab, notch)
其中
- x 指定数据向量
- xlab 指定x轴的标签
- ylab 指定y轴的标签
- notch, 如果为 “true”,则在方框的两边创建缺口。
注意: 要了解 boxplot() 函数中更多的可选参数,请在R控制台使用下面的命令。
help("boxplot")
例子
# defining vector with ages of employees
x <- c(42, 21, 22, 24, 25, 30, 29, 22,
    23, 23, 24, 28, 32, 45, 39, 40)

# output to be present as PNG file
png(file = "boxplot.png")

# plotting
boxplot(x, xlab = "Box Plot", ylab = "Age",
col.axis = "darkgreen", col.lab = "darkgreen")

# saving the file
dev.off()
输出
 极客教程
极客教程