R语言 使用facet_wrap的饼图
一般来说,Facetting是指将输出的图表(plot)窗口分割成网格,在同一区域显示类似的图表。这可以通过R编程语言中的ggplot2包来实现。
语法: facet_wrap(facet, nrow, ncol, scales, shrink, dir, strip.position)
其中,
- facets – 分组变量的集合(数据表
- nrow, ncol – 分别指定行和列的数量
- scales – 这里指定的尺度应该是固定的还是自由的
- shrink – 如果为 “true”,将缩减尺度以适应统计数字的输出
- dir – 用于指定绘图的方向(”h “代表水平方向,”v “代表垂直方向)。
- strip.position – 用来指定标签的位置。
使用facet_wrap()绘制饼图的步骤
安装并加载所需的软件包。
install.pckages("data.table")
install.packages("ggplot2")

library(ggplot2)
library(data.table)
创建带有组和子组的样本数据框架,并将其转换为数据表,如下所示。
df <- data.frame(
Names = c("Anu","Bhuvana","Dilip","Harika",
          "Harish","Tarun","Srujan","Sandhya"),
Company = c("Microsoft","Adobe","Adobe",
            "Microsoft","Meta","Meta",
            "Microsoft","Adobe"),
Branch =c("CSE","IT","CSE","CSE","IT",
          "IT","CSE","IT")
)
# Conversion of data frame to data table
dt <- data.table(df)
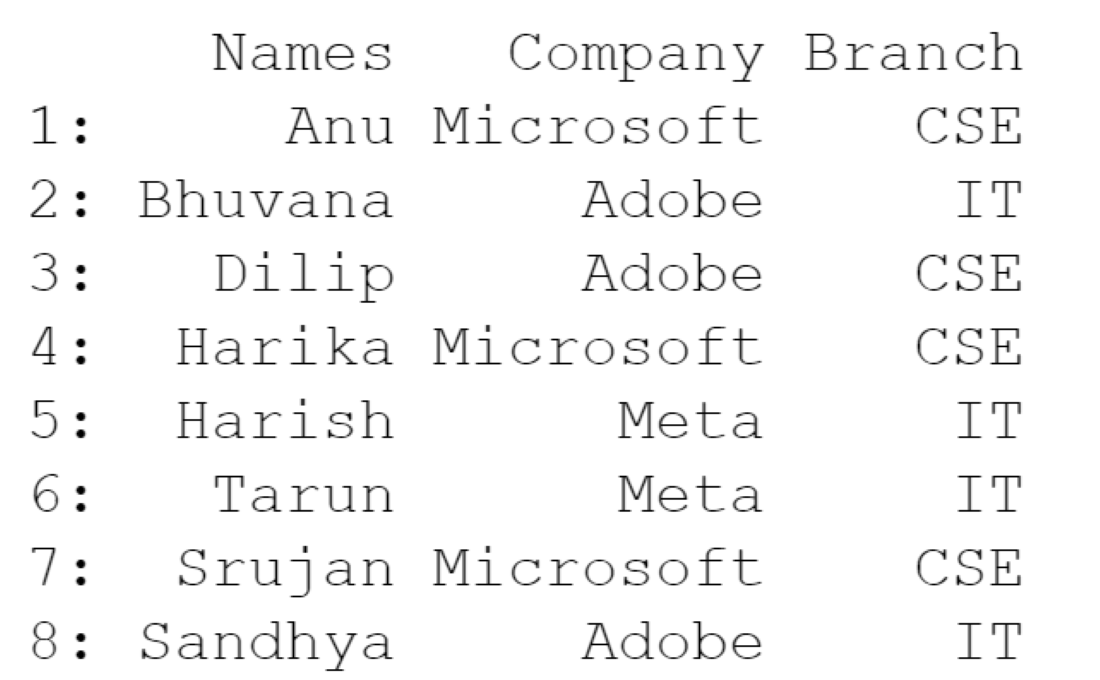
print(dt)
输出

制作饼状图的数据框架样本
使用ggplot2软件包为我们的数据框架绘制基本饼图。
pie_plot <- ggplot2::ggplot(dt,aes(x=1, y=Branch, fill=Company)) +
            geom_bar(stat="identity", width=2) +
            coord_polar(theta='y') +
            labs(title="Basic Pie Plot using ggplot")
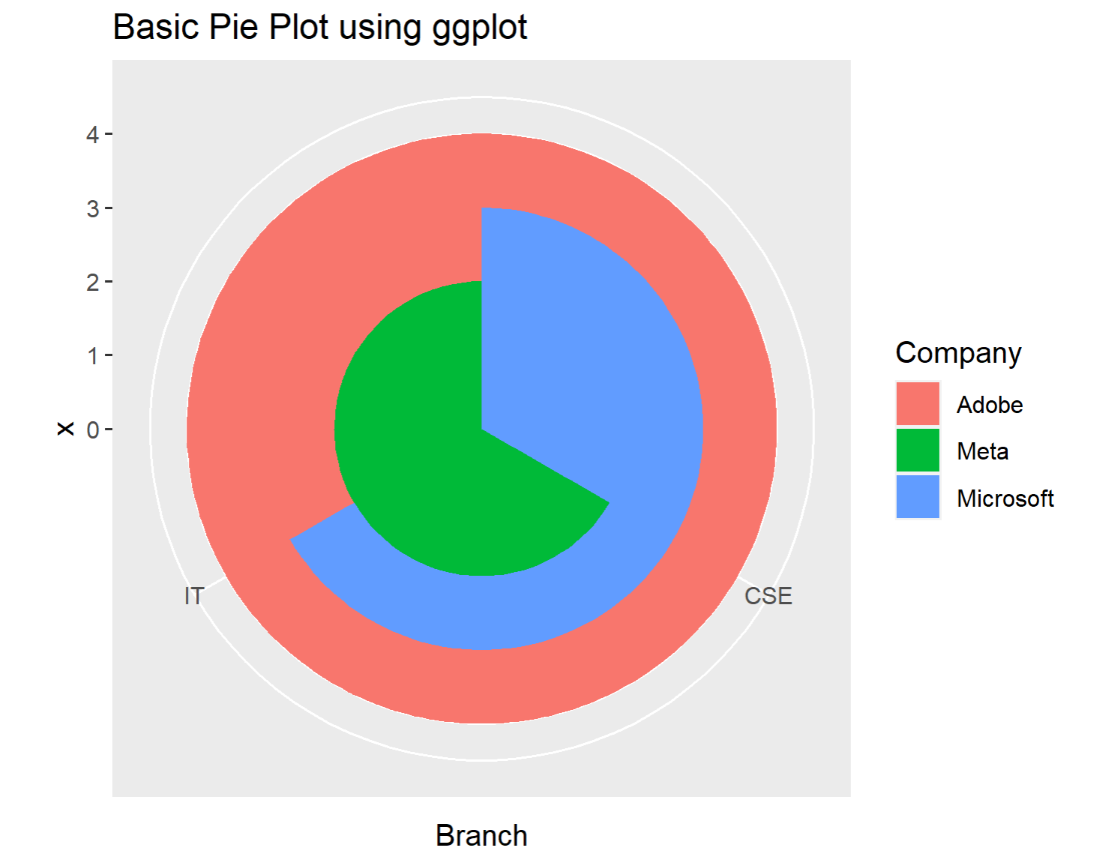
pie_plot
输出

使用ggplot绘制饼状图
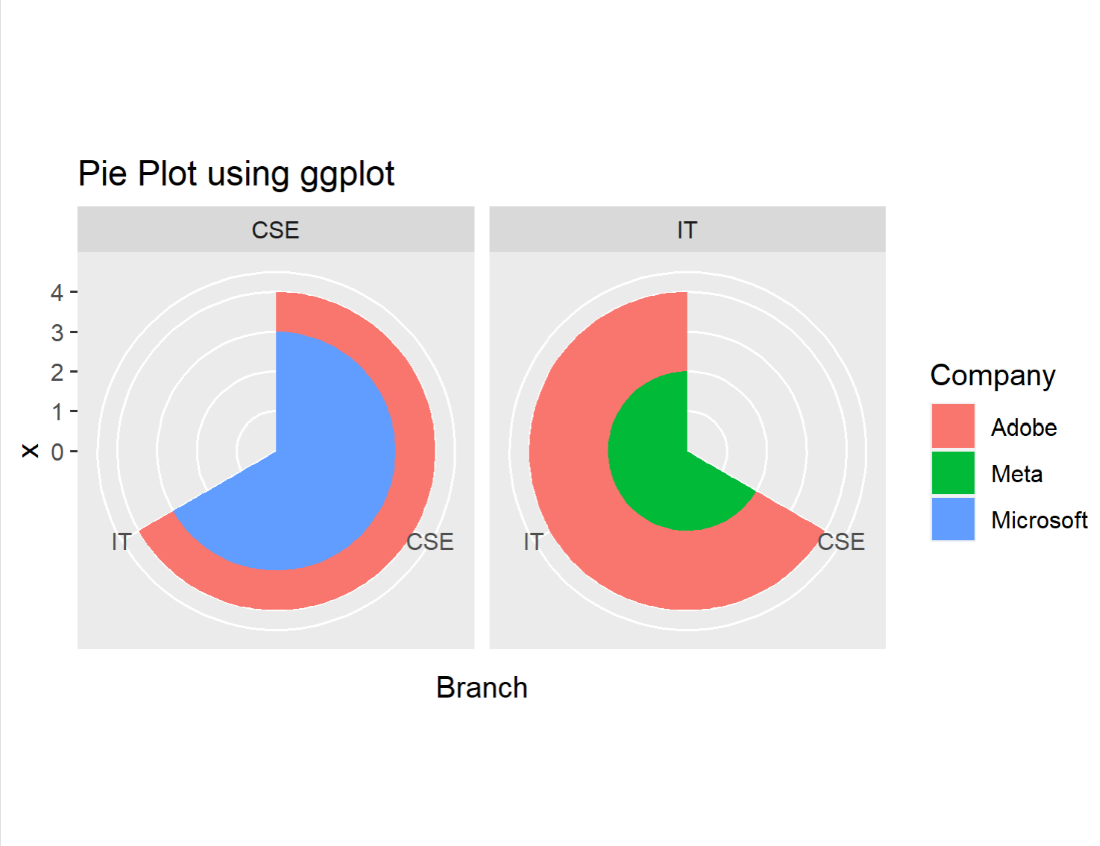
在这个例子中,我们使用facet_wrap()函数对饼图进行基于学生分支的分面处理,如下所示
pie_plot <- pie_plot+facet_wrap(~Branch)
pie_plot
输出

使用facet_wrap()绘制饼图
 极客教程
极客教程