R语言 交互式气泡图
泡沫图 用于寻找和显示数字变量之间的关系。通过这种技术,数据集在两到四个维度上被可视化。它被用来寻找对商业和工业部门的各种洞察力。这个图表是在 R编程语言 中使用Highcharter Libray实现的。Highcharter是一个开源库,它为程序以及网络应用提供了用户友好的互动图表。
例子:创建交互式气泡图 国家间销售后剩下的水果。
| 国家 | 苹果 | 芒果 | 左边的水果 |
|---|---|---|---|
| 印度 | 1000 | 100 | 10 |
| 美国 | 3000 | 200 | 20 |
| 加拿大 | 2500 | 300 | 30 |
| 马来西亚 | 6500 | 450 | 40 |
| 日本 | 5000 | 600 | 50 |
使用highcharter创建交互式气泡图
加载数据集并导入Highcharter库。使用hchart函数创建一个图表对象。向hchart(type, axes, max size)传递需要绘制的类型、尊重的数据向量和气泡的大小。
# Creating dataframe for chart.
countries = c('India', 'Usa', 'Canada',
              'Malaysia', 'Japan')
apples = c(1000, 3000, 2500, 6500, 5000)
mangoes = c(100, 200, 300, 450, 600)
left_friuts = c(10, 20, 30, 40, 50)
df = data.frame(countries, apples, mangoes,
              left_friuts)

# Importing Library
library(highcharter)

# Creating Chart Object.
chart <- df %>% hchart('scatter',
                       hcaes(x = apples,
                             y = mangoes,
                             size = left_friuts),
                       maxSize = "10%")
chart
输出

样本数据集的交互式气泡图
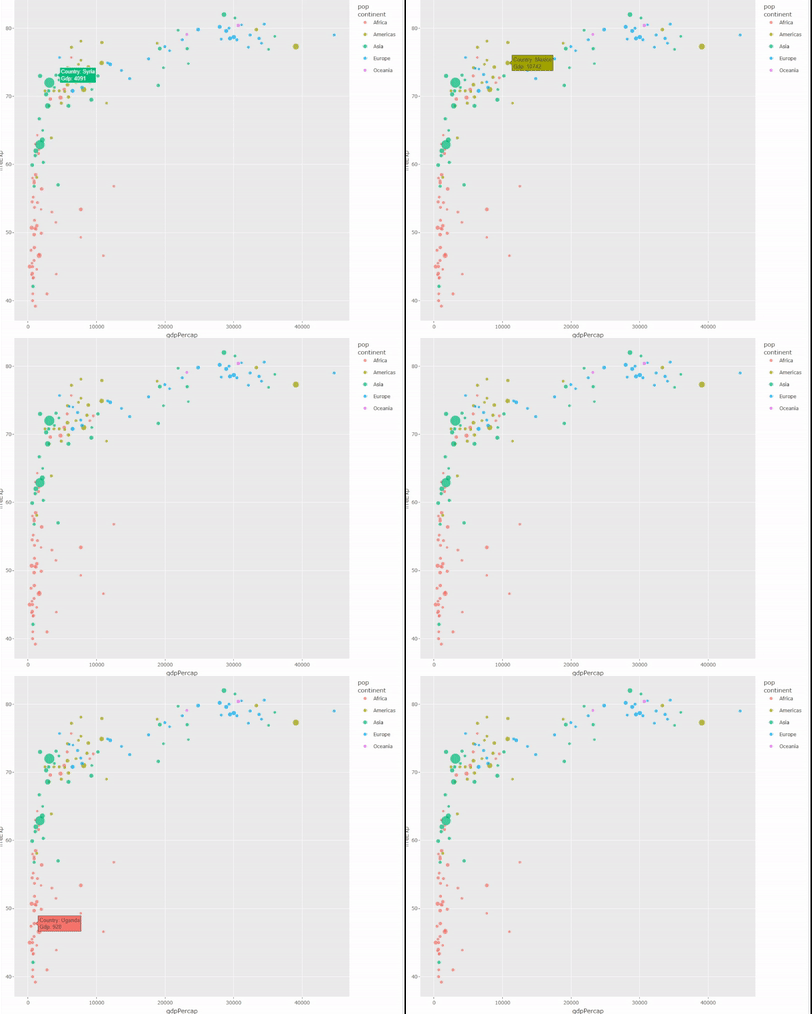
使用ggplot2和plotly创建交互式泡沫图
R编程语言中的ggplot2包也被称为图形的语法,它是免费的开放源码,易于使用。ggplot2将只制作图形。
加载gapminder数据集并过滤需要在图表上显示的数据。准备一个需要在图形上显示的工具提示,并将x轴、y轴、大小、属性和工具提示传递给ggplot(ais(x, y, size, color, text))。对于显示关系,选择geom_point()函数。使用ggplotly(data, tooltip)使该图具有交互性。
# Libraries
library(ggplot2)
library(dplyr)
library(plotly)

# The dataset is provided in the gapminder library
library(gapminder)
data <- gapminder %>% filter(year=="2002")
    %>% dplyr::select(-year)
data

# Rounding the values for tooltip
data <- data %>%
  mutate(gdpPercap=round(gdpPercap,0)) %>%
  mutate(pop=round(pop/1000000,2)) %>%
  mutate(lifeExp=round(lifeExp,1)) %>%

# Text tooltip to display
  mutate(text = paste("Country: ",
                      country,"\nGdp: ",
                      gdpPercap, sep="")) %>%

# Classic ggplot
  ggplot(aes(x=gdpPercap,
             y=lifeExp,
             size = pop,
             color = continent,
             text=text)) +
  geom_point(alpha=0.7)


# Turn ggplot interactive with plotly
chart <- ggplotly(data, tooltip="text")
chart
输出

交互式气泡图,适用于gapminder数据集
 极客教程
极客教程