R语言 GE股票价格分析
股票分析是投资者和交易者用来进行购买和销售选择的一种技术。投资者和交易者通过研究和分析以前和当前的数据,努力在市场上获得优势,做出有见地的判断。
在这篇文章中,我们将使用R编程语言分析 “GE股票价格 “数据集。
所使用的库
- dplyr – R编程语言的dplyr包是一个数据处理框架,它提供了一套一致的动词,以帮助解决最经常面临的数据处理困难。
- stringi – R编程语言中的stringi包用于任何地区或字符编码的字符串/文本处理,具有高度的快速性、可移植性、准确性、一致性和简易性。
导入库
我们首先要安装dplyr包和stringi库
# Importing the library stringi
# for string manipulation
library(stringi)

# Using the library function
# to import the dplyr package
library(dplyr)
现在我们将读取CSV文件,以便进行分析。
导入数据集
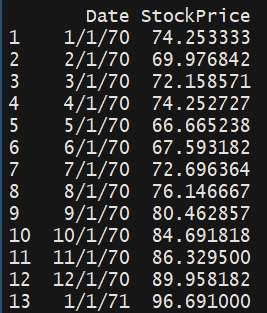
我们首先定义CSV文件在我们本地机器上的路径。然后我们读取CSV文件并将数据存储在变量名df中。 我们进一步显示数据框’df’的内容。
该数据集可以从以下链接下载和访问:这里
# Defining the path where
# the csv file is located
path = 'please paste your path here'

# Reading the csv file and storing
# the data in a variable named df
df <- read.csv(path)

# Displaying the data frame on
# the screen
df
输出
列的选择
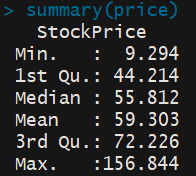
我们现在将探讨数字特征’StockPrice’列。我们使用’summary’函数获得了股票价格列的数字摘要。这显示了最低股票价格,第一四分位数,股票价格中位数,平均股票价格,第三四分位数,和最高股票价格。
# Getting only the price
price <- select(df,StockPrice)

# Obtaining a numerical summary
# of the price column
summary(price)
输出
数据可视化
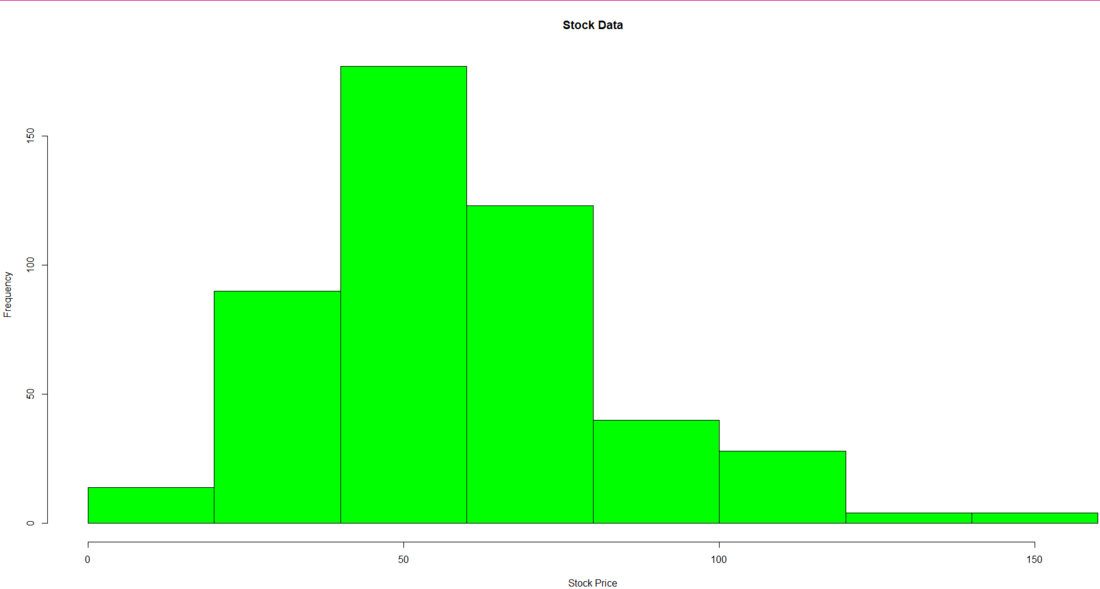
我们现在将使用’hist’函数制作一个股票价格数据的直方图。我们传递 “股票价格 “列,并在直方图上应用标签和标题。我们使用col参数为直方图添加颜色。
# Producing a histogram of the
# Stock Price Data
hist(as.vector(price$StockPrice),
     xlab='Stock Price',
     main='Stock Data',
     col='green')
输出
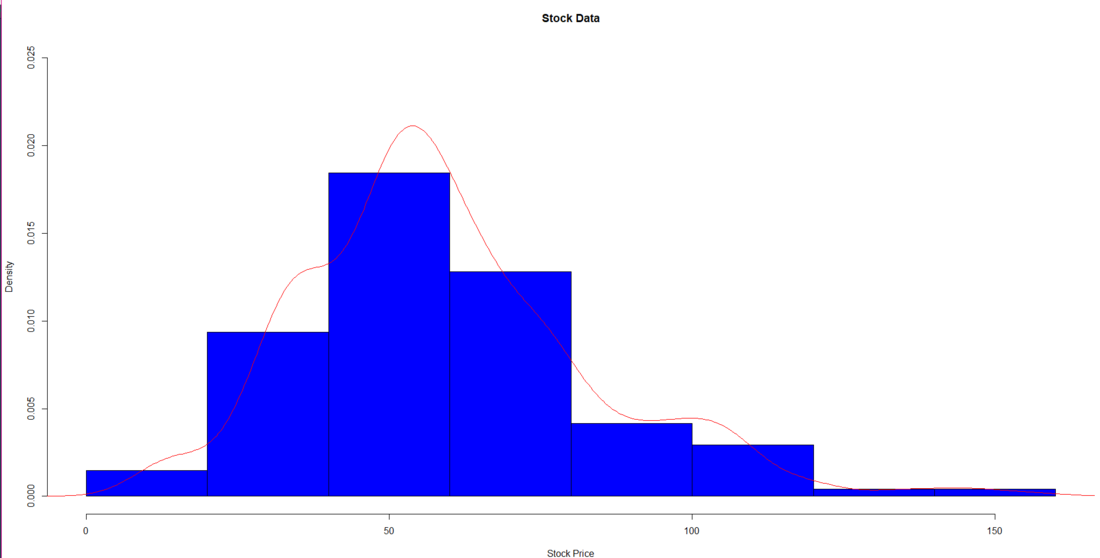
我们现在将产生一个基于密度的股票价格数据的直方图。为了产生基于密度的直方图,我们使用了’lines’函数,并传递了核心密度值 股票价格栏。为了获得内核密度值,我们使用了密度函数。然后我们给直方图加上了标签和标题。我们使用col参数为直方图添加颜色。
# Producing a density based histogram
hist(as.vector(priceStockPrice),
     xlab='Stock Price',
     main='Stock Data',
     col='blue',
     prob=TRUE,
     ylim=c(0,0.025))
lines(density(priceStockPrice),col='red')
输出
现在我们将绘制一个按年份划分的股票价格数据的线图。我们已经从日期中提取了年份。(我们提取了代表年份的日期的最后两位数字)。
为了从日期栏中只提取年份,我们遵循这个过程
- 检查日期列的类别
- 将日期列的数据转换为字符数据类型
- 使用stri_sub函数从Date列中只提取年份,并使用mutate函数将其应用于所有数据
然后,我们最后绘制数据的图表。然后,我们将突变后的df的日期列作为x轴的标签传递出去
# Extracting only the year
# from the Date column
# Checking the class of
# the Date column
class(dfDate)

# Converting the Date column
# data to a character
as.character(dfDate)

# Extracting only the year from
# the Date column
Mutateddf < - df % > % mutate(Date=stri_sub(Date, -2))
Mutateddf

# Plotting a line graph of the data
plot(MutateddfStockPrice,
     type='l',
     axes=FALSE,
     xlab='Year',
     ylab='Stock Price',
     main='Year wise Stock Price',
     col='blue')
axis(1, at=1: 480, labels=MutateddfDate,
     cex.axis=0.9)
axis(2)
输出
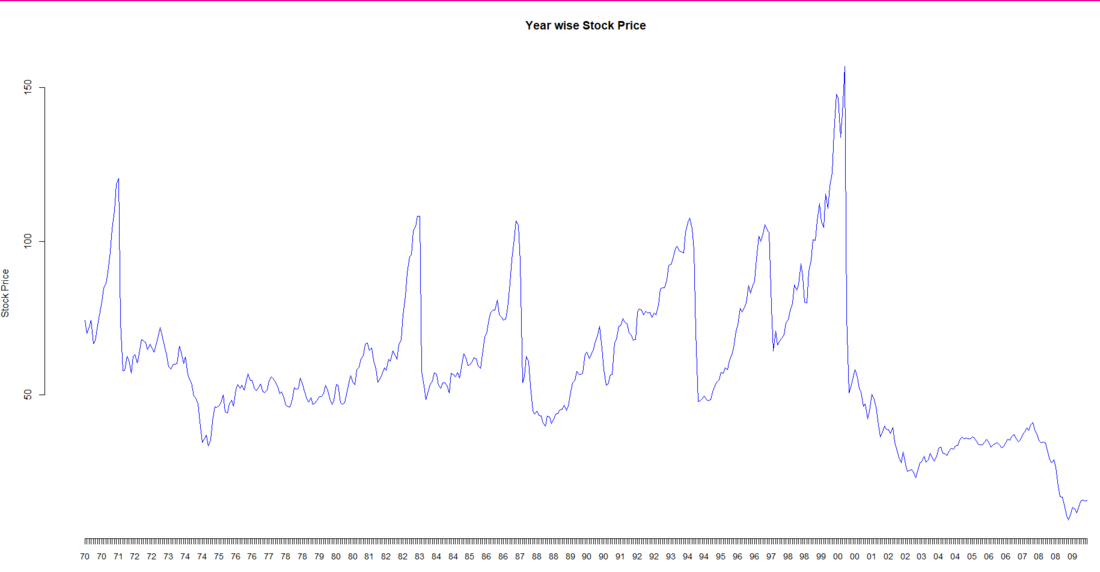
我们现在将根据数据的年份进行分组,并绘制出该年最高股票价格的柱状图。
我们首先根据年份对突变df的数据进行分组,然后得到每一年的最高股票价格,最后使用’条形图’函数绘制条形图,显示每一年的最高股票价格。
# Plotting a bar plot of
# the maximum price in a year
# Grouping the data by the Date
# (Year)
groupeddf <- group_by(Mutateddf,Date)

# Extracting the maximum share
# price for each year
maxdf <- summarize(groupeddf,max(StockPrice))

# Plotting the data in a bar chart
barplot(maxdf`max(StockPrice)`,
        main='maximum price in each year',
        xlab='Maximum Stock Price',
        ylab='Year',
        names.arg=maxdfDate,
        col=c('blue','green','pink','yellow',
              'red','purple','orange'))
输出
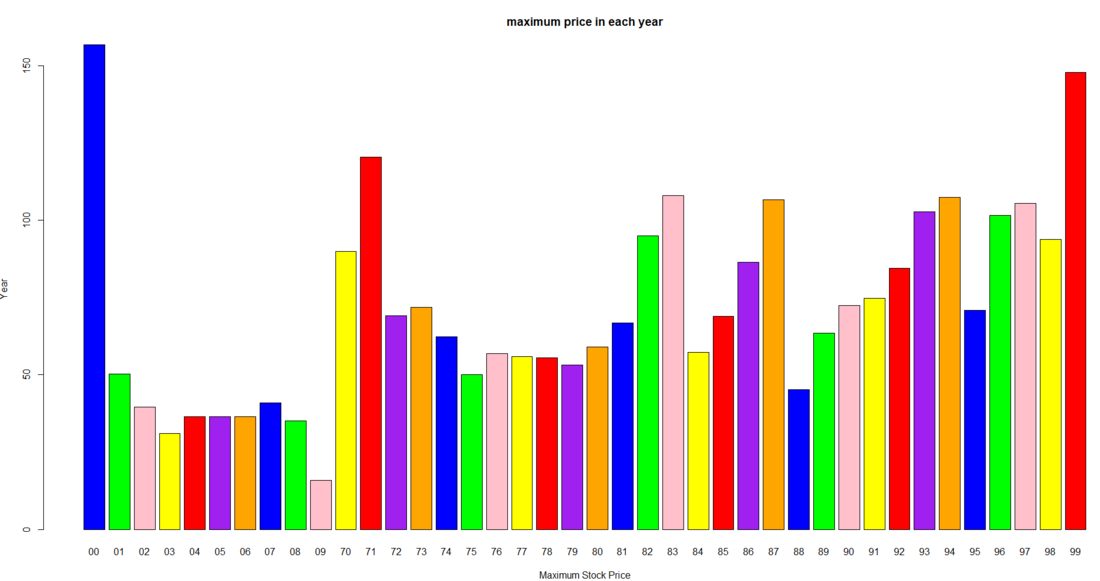
结论
上述研究可用于理解一只股票的短期和长期行为。根据投资者的风险承受能力,可以进一步开发一个决策支持系统,以帮助用户从行业中选择哪只股票。
注: 在日期栏中,只有日期的最后两位数字。因此,1/1/70意味着1970年1月1日。
 极客教程
极客教程