R语言 分叉条形图
分歧条形图是一种条形图,主要用于比较两个或多个变量,这些变量被绘制在中间条形图的不同侧面。在发散条形图中,正数的图表被绘制在发散(中间)轴的右侧,负数的数值被放置在发散轴的另一侧(左侧)。在R编程中,我们可以使用ggplot()函数实现它们,该函数存在于ggplot2包中。
语法: ggplot(df,ais,fill,y)+geom_bar()+coord_flip()
其中。
- df – 需要绘制的数据框架
- aes – 这里给出了绘图的美感(如何对数据框的值进行排序和绘制)。
- fill – 用于指定要在数据框中填充的值
- y – 用于指定需要在y轴上显示的标签
- geom_bar() – 包含了绘制条形图的功能
- coord_flip() – 用于旋转绘图并使y成为主轴 [ 默认情况下,条形图是沿着x作为主轴绘图的]
在开始之前,我们将需要ggplot模块和数据集。为此,请运行下面的代码。
# Install required packages (ggplot2)
install.packages("ggplot2")
# Load the package into current working environment
library(ggplot2)

# creation of sample data frame
df <- data.frame(letters=LETTERS[1:26],
                 value=rnorm(26))
一旦我们加载了模块和数据集,我们现在就可以继续进行分歧条形图的制作。
分歧条形图
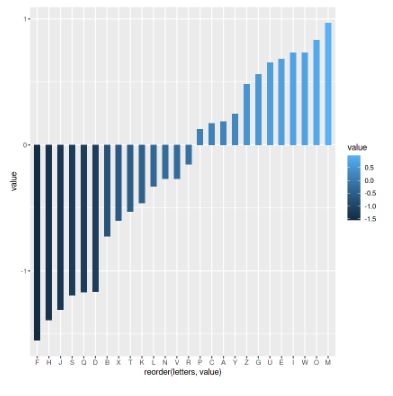
在这里,我们将为数据集绘制柱状图,并设置宽度为0.5。
# Diverging Bar plot using ggplot()
ggplot(df,aes(x=reorder(letters,value),
              fill=value,y=value))+
    geom_bar(stat='identity',width=0.5)
输出
自定义发散性条形图
如果我们观察上面的图,它的互动性较差,所以我们要定制上面的图,这样我们就可以通过标示它的每一个部分来了解更多的图。因此,定制上述图表的步骤如下…
改变宽度和翻转坐标
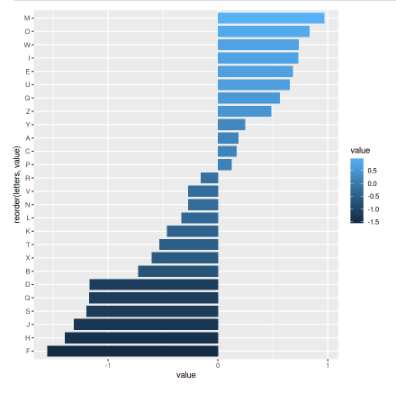
利用这个,我们可以改变条形图的宽度,也可以翻转坐标轴。
语法:geom_bar(width)+coord_flip()
其中:宽度用于指定条形图的宽度。
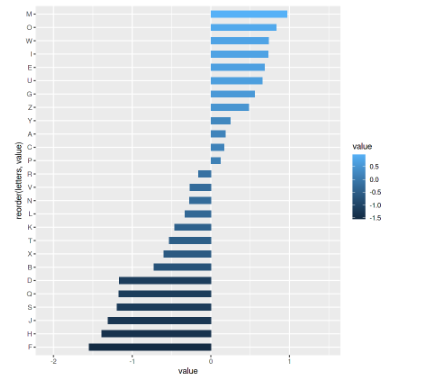
ggplot(df,aes(x=reorder(letters,value),fill=value,y=value))+
    # Plotting the bar plot using geom_bar()
    geom_bar(stat='identity',width=0.8)+coord_flip()
输出:
映射值
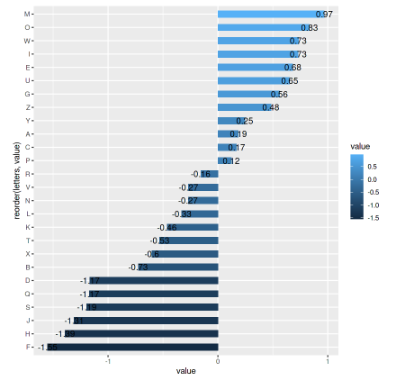
在绘制条形图后,我们需要根据每一个条形图的数值进行标注,为此我们需要使用geom_text(),它用于通过指定条形图的美学特征来添加文本标签。
语法:geom_text(mapping)
其中mapping用于定义我们想用ais()函数来标记的图的美学特征。
ggplot(df,aes(x=reorder(letters,value),fill=value,y=value))+
    # Plotting the bar plot using geom_bar()
    geom_bar(stat='identity',width=0.5)+coord_flip()+
    # Adding text labels to bar in the bar plot using geom_text()
    geom_text(aes(label=round(value,2)))
输出
添加标签和标题
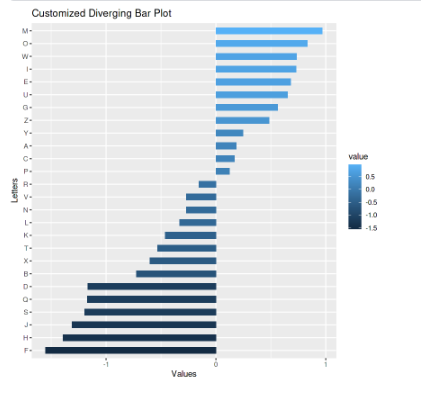
在为每个条形图添加标签后,我们还可以指定X、Y轴的标签和绘图的标题。
ggplot(df,aes(x=reorder(letters,value),fill=value,y=value))+
  # Plotting the bar plot using geom_bar()
  geom_bar(stat='identity',width=0.5)+coord_flip()+
  # Specifying the x,y axis labels and tile of the plot
  xlab("Letters")+ylab("Values")+labs(title="Customized Diverging Bar Plot")
输出
缩放
为了给绘图的轴添加限制,我们需要使用scale_y_continuous()函数(因为我们的主轴是Y轴)。
语法: scale_y_continuous(break,limit)
其中
- breaks – 用于通过定义它们之间的差异来指定绘图的断点(min,max,by=difference)
- limits – 用于根据条形图的最小和最大值来指定图的限制。
ggplot(df,aes(x=reorder(letters,value),fill=value,y=value))+
  # Plotting the bar plot using geom_bar()
  geom_bar(stat='identity',width=0.5)+coord_flip()+
  # Defining the axis limits using scale_Y_continuous()
  scale_y_continuous(breaks= seq(-2, 2, by = 1),
                     limits = c(min(dfvalue) - 0.5,max(dfvalue) + 0.5))
输出:
填充梯度
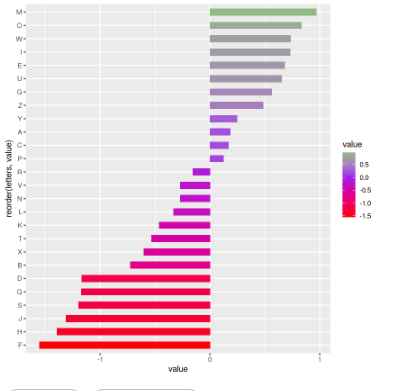
最后,我们还可以使用ggplot包中的scale_fill_gradient2()函数,用梯度颜色来定制绘图的颜色。这个函数将根据获得的数值范围来应用梯度颜色。
语法:scale_fill_gradient2(low,mid,high)
ggplot(df,aes(x=reorder(letters,value),fill=value,y=value))+
  # Plotting the bar plot using geom_bar()
  geom_bar(stat='identity',width=0.5)+coord_flip()+
  # Filling the gradient color based on obtained values
  scale_fill_gradient2(low = "red",mid = "purple",high = "green")+
    coord_flip()
输出
 极客教程
极客教程