R语言 用ggvis R为线形图创建二级y轴
在这篇文章中,我们将研究为使用ggvis包创建的线图添加辅助Y轴的问题。R支持大量的v R数据可视化和图形创建包,可以在R工作环境中调用。ggvis包是用来创建可视化的交互式图形工具,用于数据的绘制和表示。该包可以通过以下命令安装到工作空间中。
install.packages("ggvis")
使用这个软件包可以启动一个ggvis图形窗口。它被用来在提供给它的数据点的基础上创建动态图。大量的格式化和风格化选项也可以与它一起使用,以增加用户的互动性。ggvis()和add_axis()方法的语法如下所示。
R语言中ggvis方法的语法
语法: ggvis( data , mp1, mp2.,)
参数
- data – 要绘制的数据集
- mp1 , mp2 , … – 要绘制的地图变量
R语言中add_axis函数的语法
语法: add_axis( vis, axes , orient , title )
参数
- vis – 用于绘图的ggvis对象
- axes – 用于绘图的坐标轴
- orient - 用于轴的方向
- title – 轴的标题
例子1
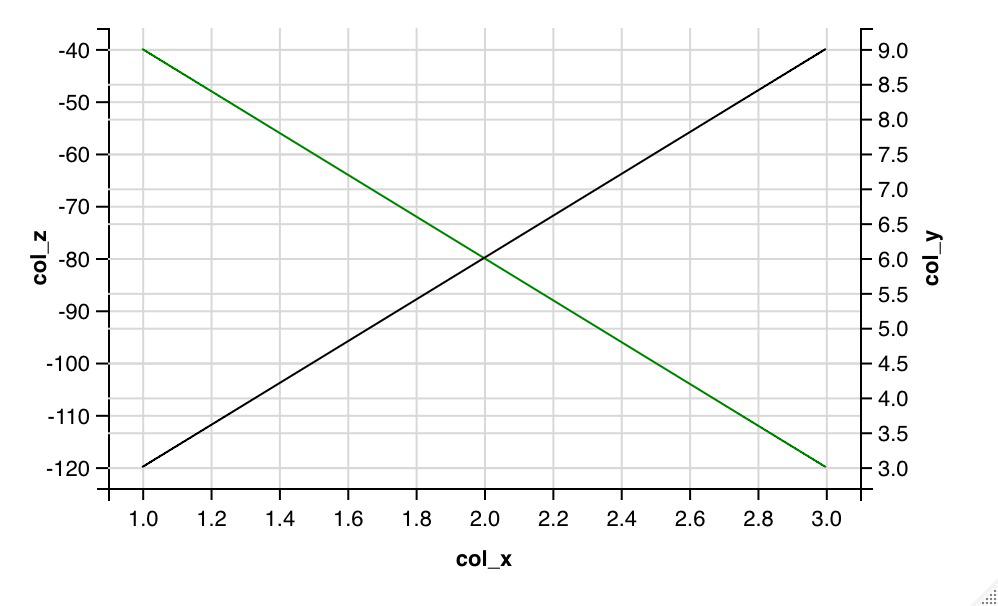
最初,在工作环境中使用ggvis()方法启动一个图形窗口,该方法需要X轴表示法的参数。然后添加add_axis方法,为绘制的图形的轴绘制标签。它可以用来覆盖轴的默认值。
# installing the required libraries
library(dplyr)
library(ggvis)
# creating a data frame of three columns
data_frame = data.frame(col_x = c(1,2,3),
                        col_y = c(3,6,9),
                        col_z = c(-40,-80,-120))
# taking a common x-axis
data_frame  %>% ggvis(x = ~col_x) %>%
  # plotting a line for the x and z columns respectively
  layer_lines(y = ~col_z, stroke := "green") %>%
  # providing label for left y-axis
  add_axis("y", orient = "left", title = "col_z" ) %>%
  # using the y numeric scale for data plotting
  scale_numeric("y", nice = FALSE) %>%
  # providing label for right y-axis
  add_axis("y", 'ympg' , orient = "right", title= "col_y" ) %>%
  # plotting a line for the x and y columns respectively
  layer_lines( prop('y' , ~col_y,  scale='ympg') ) %>%
  # adding the label for x-axis respectively
  add_axis("x", title = "col_x"  )
输出
[1] "Data Frame"
> print(data_frame)
 col_x col_y col_z
1     1     3   -40
2     2     6   -80
3     3     9  -120

例2
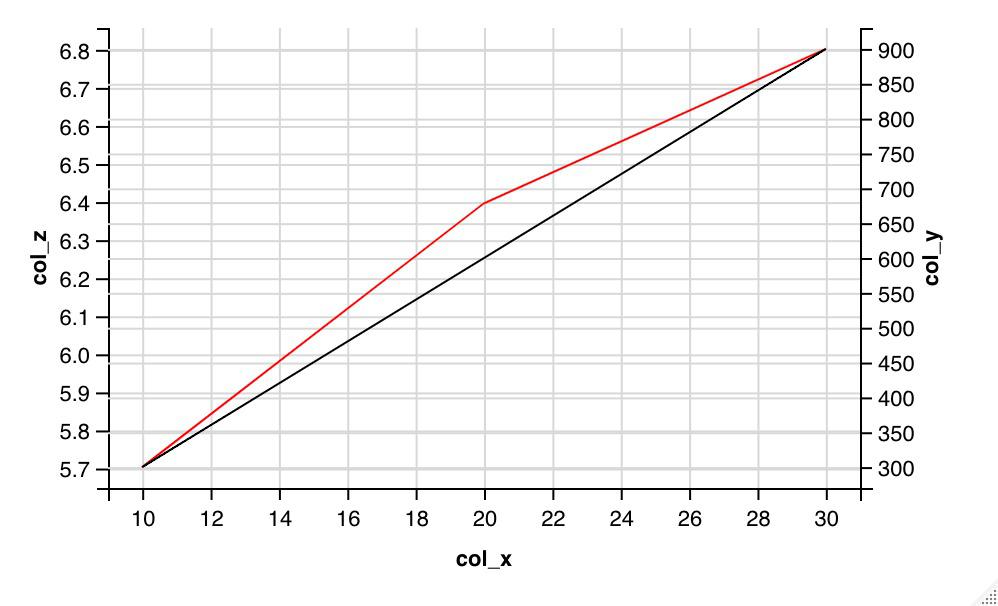
在下面的例子中,通过取第二列的对数在数据框架中创建了一个新的列。然后绘制线条,分别考虑x-y轴和x-z轴的刻度。
# installing the required libraries
library(dplyr)
library(ggvis)
# creating a data frame of three columns
data_frame = data.frame(col_x = c(10,20,30),
                        col_y = c(300,600,900),
                        )
# printing the data frame
print("Data Frame")
print(data_frame)
# taking a common x-axis
data_frame  %>%
  mutate(col_z=log(col_y)) %>%
  ggvis(x = ~col_x) %>%
  # plotting a line for the x and z columns respectively
  layer_lines(y = ~col_z, stroke := "red") %>%
  # providing label for left y-axis
  add_axis("y", orient = "left", title = "col_z" ) %>%
  # using the y numeric scale for data plotting
  scale_numeric("y", nice = FALSE) %>%
  # providing label for right y-axis
  add_axis("y", 'ympg' , orient = "right", title= "col_y" ) %>%
  # plotting a line for the x and y columns respectively
  layer_lines( prop('y' , ~col_y,  scale='ympg') ) %>%
  # adding the label for x-axis respectively
  add_axis("x", title = "col_x"  )
输出
[1] "Data Frame"
> print(data_frame)
col_x col_y
1    10   300
2    20   600
3    30   900

 极客教程
极客教程