R语言 合并图谱
在某些情况下,数据分析师可能会在同一时间查看不同的图,并需要利用它们产生结果。在这篇文章中,我们将讨论如何在R编程中组合图。这可以通过par()方法来实现。
语法: par(mfrow,mfcol,layout())
其中。
- mfrow – 用于确定网格的值为(no_of_rows,no_of_cols),并将以行为单位绘制。
- mfcol – 用于确定网格的值为(no_of_columns,no_of_rows),并将以列为单位绘制。
- layout() – 用来定制组合图的布局。[这方面的主要属性是长度为行+列的矩阵(mat)和绘图的位置] 。
使用mfrow的行明智组合图
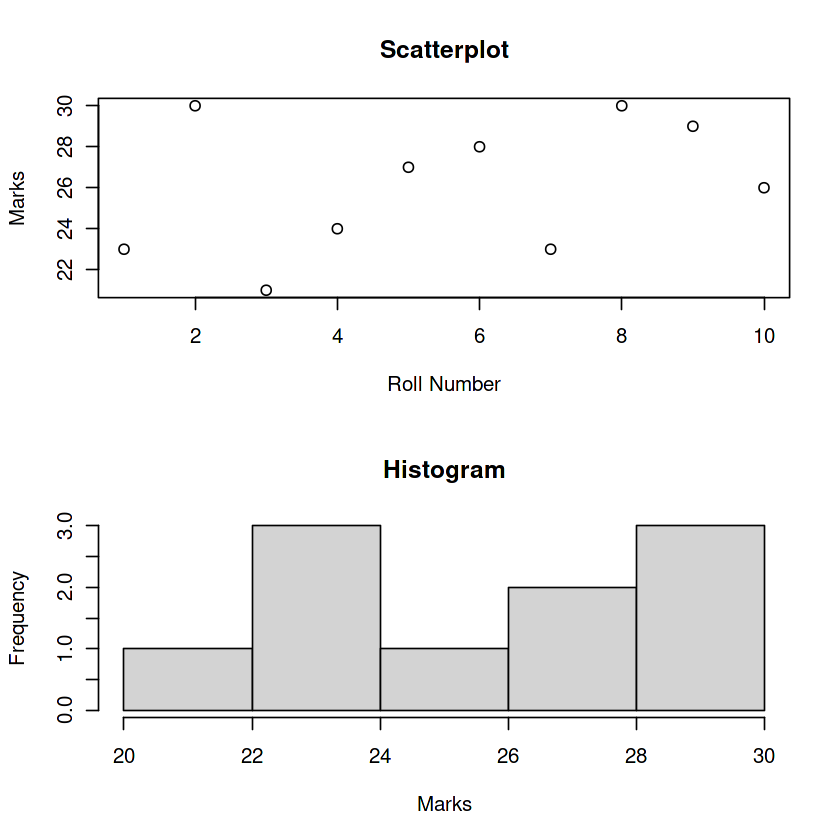
在这里,我们将创建2个绘图,并将它们按行进行组合。
# Creation of sample data frame
df<- data.frame(roll_number=c(1,2,3,4,5,6,7,8,9,10),
                marks=c(23,30,21,24,27,28,23,30,29,26))

# Combining the plot using par function
par(mfrow=c(2,1))

# Plotting scatter plot
plot(dfroll_number, dfmarks,
     main="Scatterplot",
     xlab="Roll Number", ylab="Marks")
# Plotting Histogram
hist(df$marks, main="Histogram", xlab="Marks")
输出

使用mfcol绘制的列间组合图
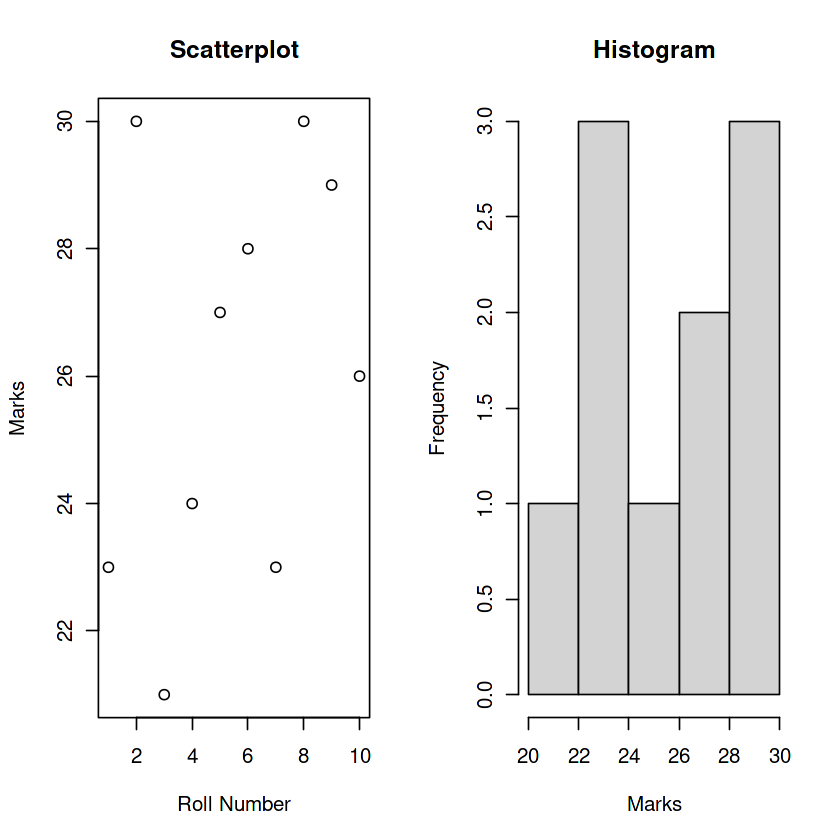
在这里,我们将创建2个绘图,并将它们按列合并。
# Combining the plot using par function
par(mfcol=c(1,2))

# Plotting scatter plot
plot(dfroll_number, dfmarks,
     main="Scatterplot",
     xlab="Roll Number", ylab="Marks")
# Plotting Histogram
hist(df$marks, main="Histogram", xlab="Marks")
输出

布局定制的组合图
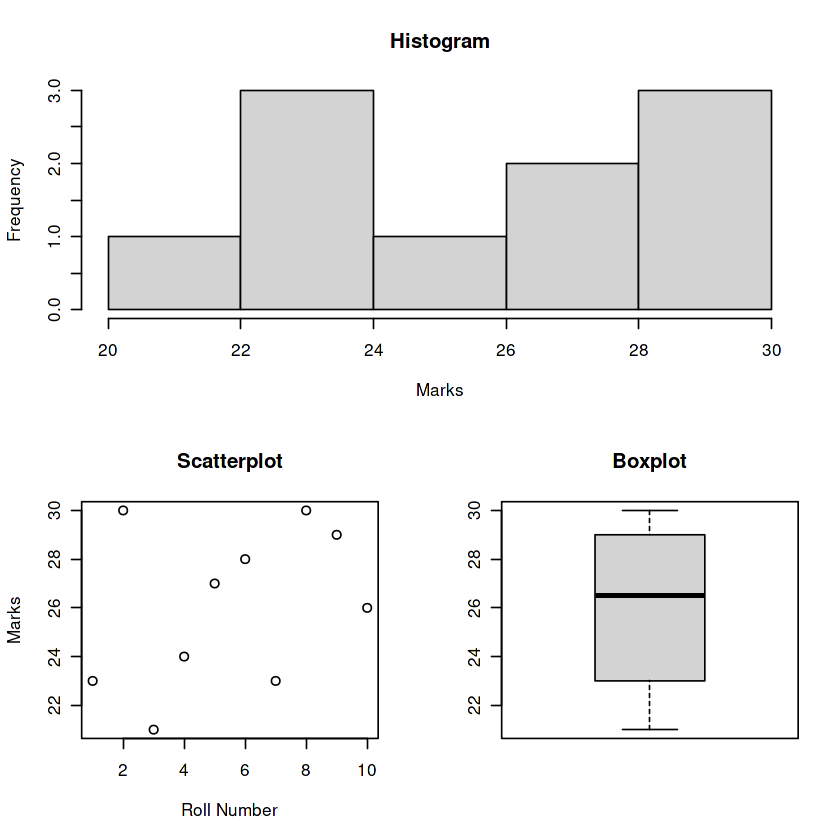
我们还可以使用 layout() 函数自定义组合图的布局,然后进行相应的绘制。让我们看一个例子。
# Combining the plots using par() function
par(mfrow=c(2,2),layout(c(1,3,3,2)))

# Customizing the layout of the combined plot
l2 <- layout(matrix(c(3,3,1,2),
                   nrow = 2,
                   ncol = 2,
                   byrow = TRUE))

# Plotting the ScatterPlot
plot(dfroll_number,dfmarks,main="Scatterplot",
     xlab="Roll Number",ylab="Marks")

# Plotting the Boxplot
boxplot(dfmarks, main="Boxplot")

# Plotting the Histogram
hist(dfmarks, main="Histogram",xlab="Marks")
输出

为了显示绘图的布局,我们可以使用 layout.show()。
# Customizing the layout of the combined plot
l <- layout(matrix(c(3,3,1,2),
                   nrow = 2,
                   ncol = 2,
                   byrow = TRUE))

# To display the layout as specifies in matrix
layout.show(l)
输出

 极客教程
极客教程