R语言 用ggplot2绘制气泡图
气泡图是一种数据可视化,它有助于在二维图中显示多个圆圈(气泡),与散点图相同。气泡图主要用于描述和显示数字变量之间的关系。
在ggplot2中,气泡图可以通过 _ geom_point()_ 函数来建立。至少要向 _ aes()_ 提供三个变量,即x、y和size。图例将由ggplot2自动显示。
语法
ggplot(data, aes(x, y, size))+ geom_point()
在上面的语法中,大小将是其中一个属性的名称,根据这些属性的值,气泡的大小将有所不同。
例子: 创建气泡图
# importing the ggplot2 library
library(ggplot2)

# creating data set columns
x <- c(12,23,43,61,78,54,34,76,58,103,39,46,52,33,11,9,60)
y <- c(12,54,34,76,54,23,43,61,78,23,12,34,56,98,67,36,54)
r <- c(1,5,13,8,12,3,2,16,7,40,23,45,76,8,7,41,23)

# creating the dataframe from the above columns
data <- data.frame(x, y, r)

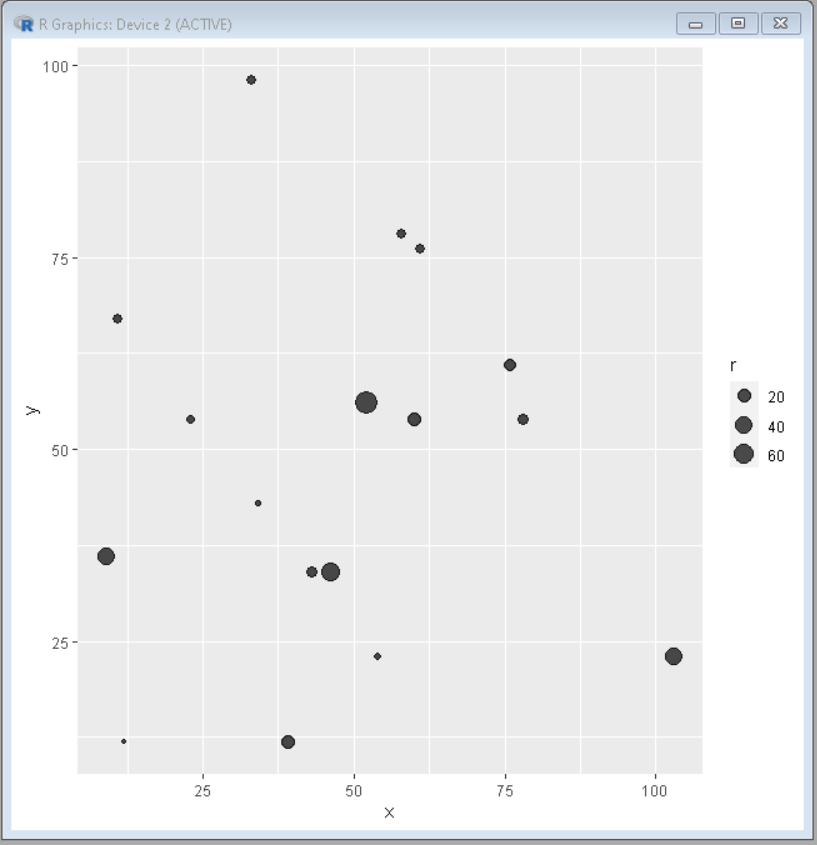
ggplot(data, aes(x = x, y = y,size = r))+ geom_point(alpha = 0.7)
输出
在上面的例子中,所有的气泡都以相同的颜色出现,因此使图表难以解释。可以在绘图中添加颜色,使气泡彼此不同。
例子: 给气泡图添加颜色
# importing the ggplot2 library
library(ggplot2)

# creating data set columns
x <- c(12,23,43,61,78,54,34,76,58,103,39,46,52,33,11)
y <- c(12,54,34,76,54,23,43,61,78,23,12,34,56,98,67)
r <- c(1,5,13,8,12,3,2,16,7,40,23,45,76,8,7)

color <- c(rep("color1", 1), rep("color2", 2),
           rep("Color3", 3), rep("color4", 4),
           rep("color5", 5))
# creating the dataframe from the above columns
data <- data.frame(x, y, r, color)

ggplot(data, aes(x = x, y = y,size = r, color=color))+
geom_point(alpha = 0.7)
输出
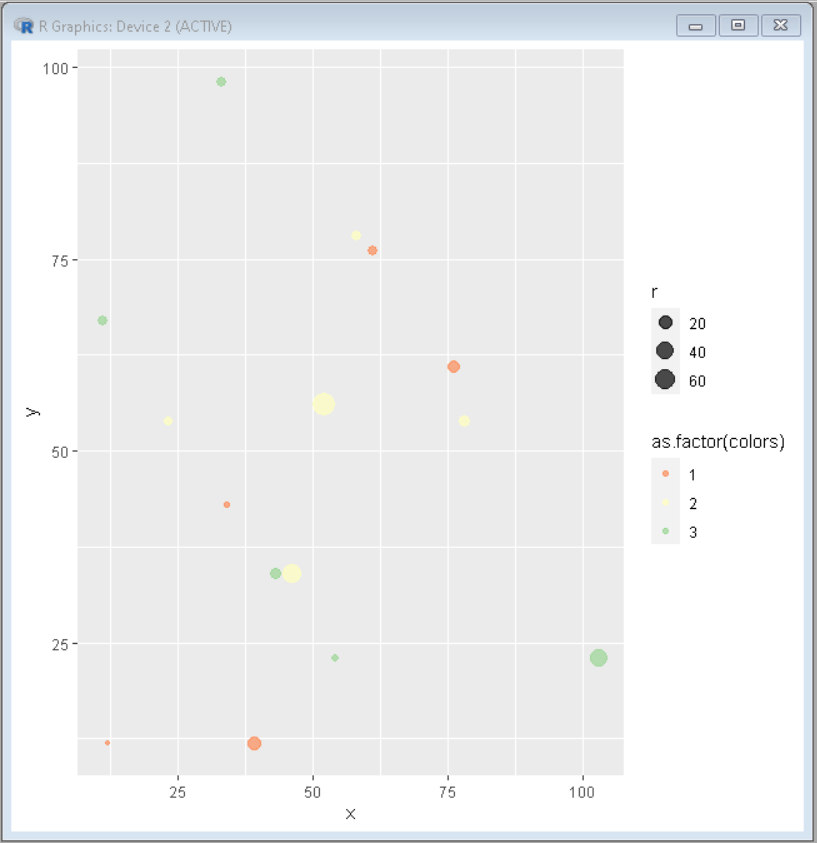
颜色可以用调色板来定制。要使用RColorBrewer调色板改变颜色,请在ggplot2的绘图代码中添加scale_color_brewer()。
语法
scale_color_brewer(palette= <Palette-Name>)
例子: 在R中自定义气泡图的颜色
# creating data set columns
x <- c(12,23,43,61,78,54,34,76,58,103,39,46,52,33,11)
y <- c(12,54,34,76,54,23,43,61,78,23,12,34,56,98,67)
r <- c(1,5,13,8,12,3,2,16,7,40,23,45,76,8,7)

colors <- c(1,2,3,1,2,3,1,1,2,3,1,2,2,3,3)

# creating the dataframe from the
# above columns
data <- data.frame(x, y, r, colors)

# importing the ggplot2 library and
# RColorBrewer
library(RColorBrewer)
library(ggplot2)

# Draw plot
ggplot(data, aes(x = x, y = y,size = r, color=as.factor(colors))) +
geom_point(alpha = 0.7)+ scale_color_brewer(palette="Spectral")
输出
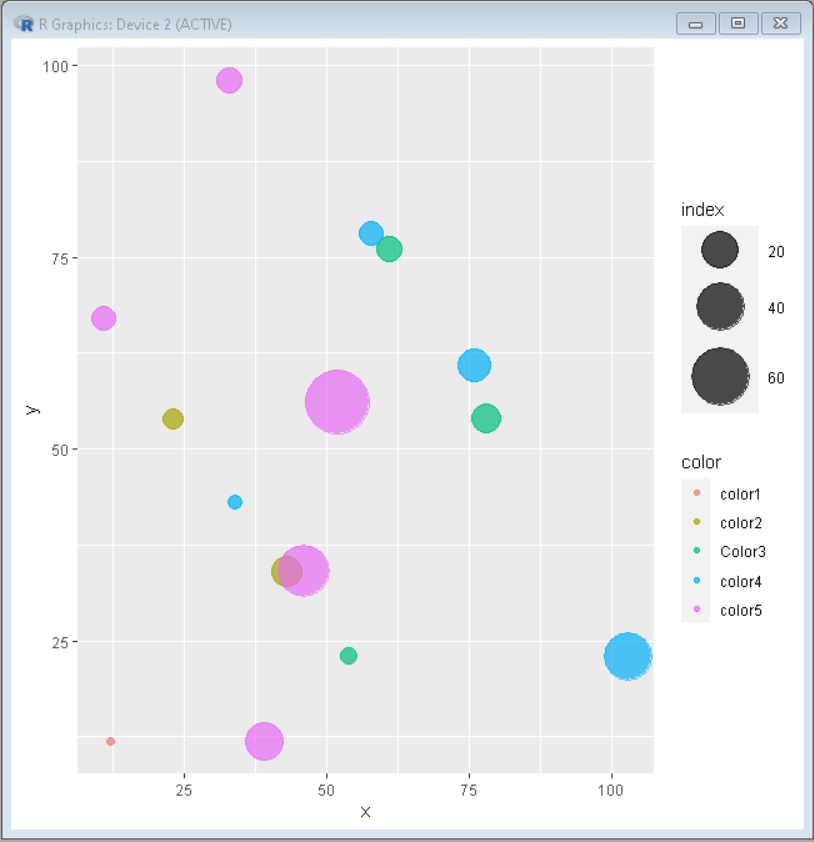
为了改变图中气泡的大小,即给出从最小的气泡到最大的气泡的大小范围,我们使用 scale_size() 这允许使用范围参数来设置最小和最大的圆圈的大小。
语法
scale_size(range =< range-vector>)
例子: 改变气泡图的大小
# creating data set columns
x <- c(12,23,43,61,78,54,34,76,58,103,39,46,52,33,11)
y <- c(12,54,34,76,54,23,43,61,78,23,12,34,56,98,67)
r <- c(1,5,13,8,12,3,2,16,7,40,23,45,76,8,7)

color <- c(rep("color1", 1), rep("color2", 2),
           rep("Color3", 3), rep("color4", 4),
           rep("color5", 5))
sizeRange <- c(2,18)

# creating the dataframe from the above
# columns
data <- data.frame(x, y, r, color)

# importing the ggplot2 library
library(ggplot2)

ggplot(data, aes(x = x, y = y,size = r, color=color))
                + geom_point(alpha = 0.7)
                + scale_size(range = sizeRange, name="index")
输出
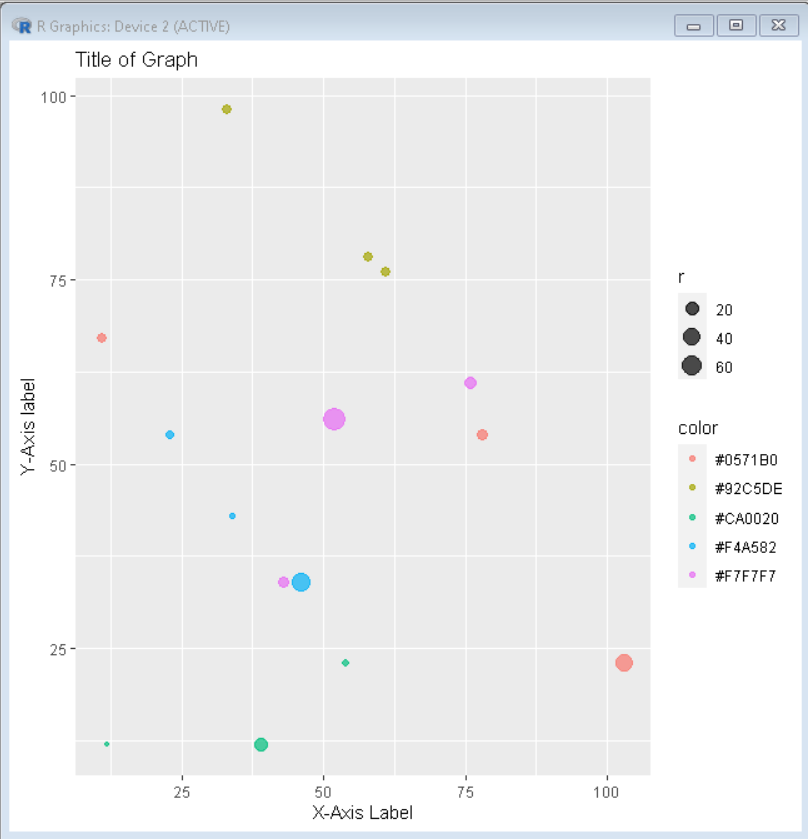
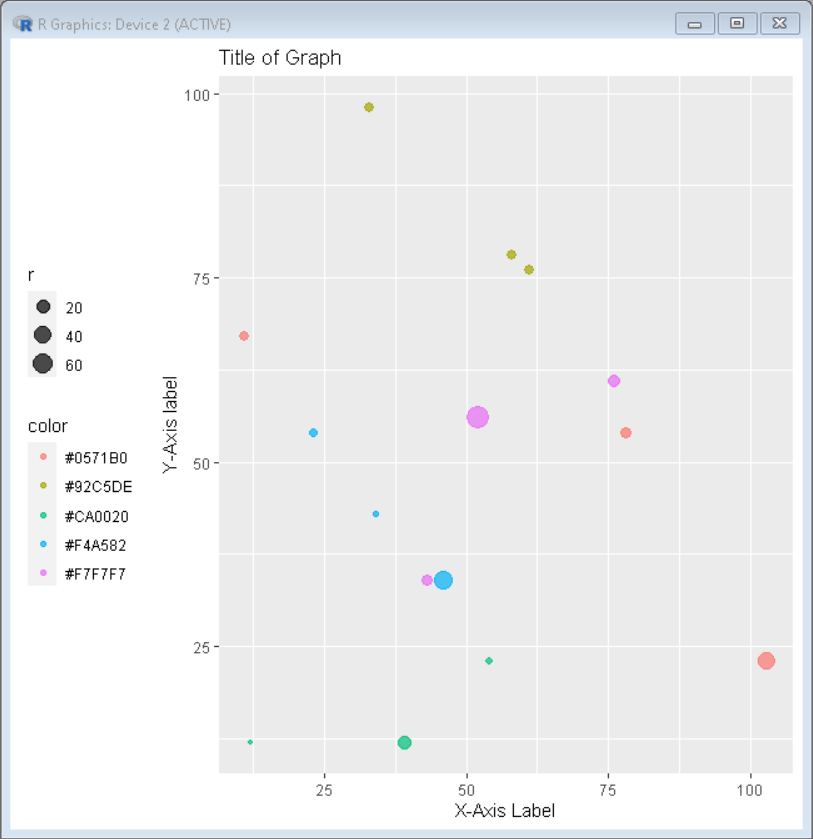
要改变坐标轴上的标签,请在你的基本ggplot代码行中添加+labs(y=”y轴名称”, x=”x轴名称“)。
例子: 在R中改变气泡图的标签
# creating data set columns
x <- c(12,23,43,61,78,54,34,76,58,103,39,46,52,33,11)
y <- c(12,54,34,76,54,23,43,61,78,23,12,34,56,98,67)
r <- c(1,5,13,8,12,3,2,16,7,40,23,45,76,8,7)

library("RColorBrewer")
color <- brewer.pal(n = 5, name = "RdBu")

# creating the dataframe from the above columns
data <- data.frame(x, y, r, color)

# importing the ggplot2 library
library(ggplot2)
ggplot(data, aes(x = x, y = y,size = r, color=color)) +
geom_point(alpha = 0.7) +
labs(title= "Title of Graph", y="Y-Axis label", x = "X-Axis Label")
输出
要改变ggplot2中图例的位置,请在ggplot2的基本代码中添加 theme()。
语法
theme(legend.position= <desired-position>)
例子: 改变气泡图的图例位置
# creating data set columns
x <- c(12,23,43,61,78,54,34,76,58,103,39,46,52,33,11)
y <- c(12,54,34,76,54,23,43,61,78,23,12,34,56,98,67)
r <- c(1,5,13,8,12,3,2,16,7,40,23,45,76,8,7)

library("RColorBrewer")
color <- brewer.pal(n = 5, name = "RdBu")

# creating the dataframe from the above columns
data <- data.frame(x, y, r, color)

# importing the ggplot2 library
library(ggplot2)

ggplot(data, aes(x = x, y = y,size = r, color=color)) +
geom_point(alpha = 0.7) +
labs(title= "Title of Graph",y="Y-Axis label", x = "X-Axis Label") +
theme(legend.position="left")
输出
 极客教程
极客教程