R语言 添加无边框和白色背景的图例
图例被定义为描述图谱各部分的一个区域。图例图是用来以图形形式显示统计数据的。我们可以使用 legend() 函数为图形添加图例。在这篇文章中,我们将看到如何在R编程语言中添加无边框和白色背景的图例。
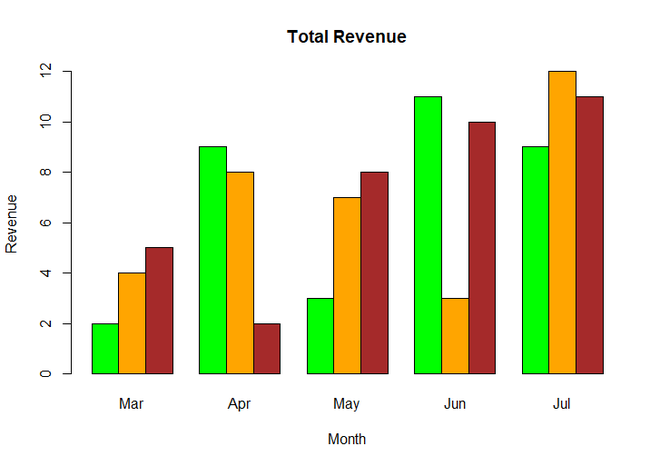
默认情况下,legend()函数会生成带有边框的图例,我们将进一步了解。首先,让我们创建一个没有任何图例的普通条形图。
语法: barplot(H, xlab, ylab, main, names.arg, col)
参数
- H: 该参数是一个包含数值的向量或矩阵,在柱状图中使用。
- xlab: 该参数是柱状图中X轴的标签。
- ylab : 这个参数是柱状图中y轴的标签。
- main: 该参数是柱状图的标题。
- names.arg: 这个参数是条形图中每个条形下出现的名称的向量。
- col: 该参数用于为图表中的条形图提供颜色。
例子
colors = c("green", "orange", "brown")
months <- c("Mar", "Apr", "May", "Jun", "Jul")

# Create the matrix of the values.
Values <- matrix(c(2, 9, 3, 11, 9, 4, 8, 7, 3, 12,
                   5, 2, 8, 10, 11),

                 nrow = 3, ncol = 5, byrow = TRUE)

# Create the bar chart
barplot(Values, main = "Total Revenue", names.arg = months,
        xlab = "Month", ylab = "Revenue",
        col = colors, beside = TRUE)
输出

简单的柱状图
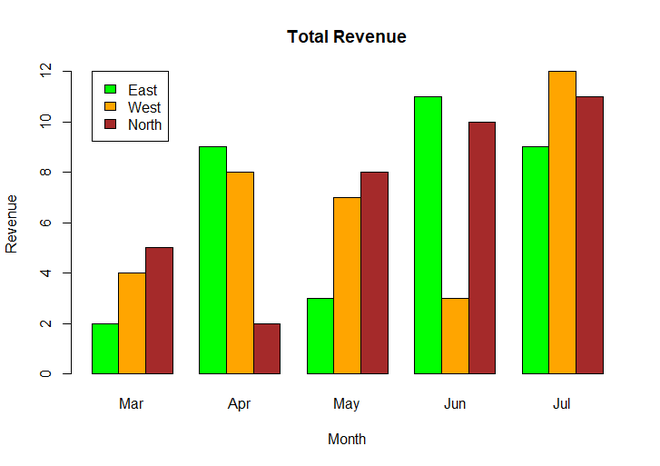
现在我们使用 legend() 函数为上述图表添加图例。
语法: legend(x, y, legend, fill, col, bg, lty, cex, title, text.font, bg)
参数 :
- x和y: 用于定位图例的坐标
- legend : 图例的文本
- fill: 用于填充图例框的颜色
- col: 线条的颜色
- bg: 它定义了图例框的背景颜色。(可选)
- title : 图例标题(可选
- text.font : 一个整数,指定图例的字体样式(可选
返回: 图形的图例
例子
colors = c("green", "orange", "brown")
months <- c("Mar", "Apr", "May", "Jun", "Jul")
regions <- c("East", "West", "North")

# Create the matrix of the values.
Values <- matrix(c(2, 9, 3, 11, 9, 4, 8, 7, 3, 12,
                   5, 2, 8, 10, 11),

                 nrow = 3, ncol = 5, byrow = TRUE)

# Create the bar chart
barplot(Values, main = "Total Revenue", names.arg = months,
        xlab = "Month", ylab = "Revenue",
        col = colors, beside = TRUE)

# Add the legend to the chart
legend(1,12, regions, cex = 1.0, fill = colors)
输出

带图例的柱状图
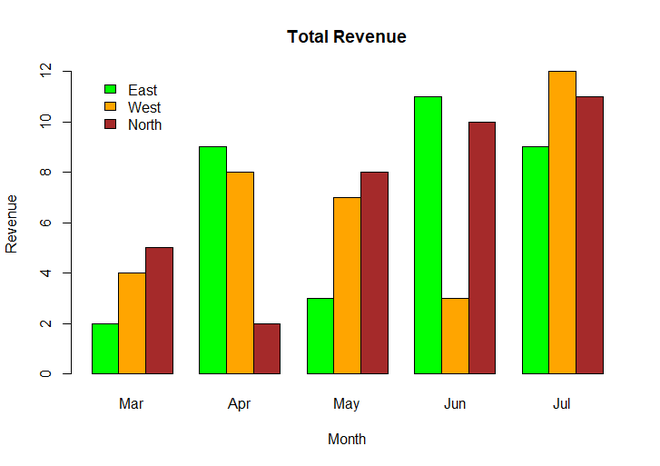
你可以看到在上面的输出图中,图例是黑色的边界。现在,我们将删除边框,并使用legend()函数中的 box.col 参数为图表添加白色背景,并将其值设置为 白色 ,以获得白色背景。
例子
colors = c("green", "orange", "brown")
months <- c("Mar", "Apr", "May", "Jun", "Jul")
regions <- c("East", "West", "North")

# Create the matrix of the values.
Values <- matrix(c(2, 9, 3, 11, 9, 4, 8, 7, 3, 12,
                   5, 2, 8, 10, 11),

                 nrow = 3, ncol = 5, byrow = TRUE)

# Create the bar chart
barplot(Values, main = "Total Revenue", names.arg = months,
        xlab = "Month", ylab = "Revenue",
        col = colors, beside = TRUE)

# Add the legend to the chart without border
# and with white background
legend(1,12, regions, cex = 1.0, fill = colors, box.col = "white")
输出

无边框和白色背景的绘图图例
 极客教程
极客教程