R语言 直方图条上添加计数和百分比标签
直方图表示指定变量的值的频率或或然率,并将其分隔成不同的范围。它将这些值分成连续的范围。直方图的每条柱子都用来表示高度,也就是该特定范围内的数值数量。
基本R中的hist()方法用于显示给定数据值的直方图。它将数据值的一个向量作为输入,并为其输出一个相应的直方图。
语法
Hist ( x , labels)
参数:
- x – 要绘制的数据点的集合
- labels – 默认为FALSE。如果为真,它被用来表示在条形图顶部的一组计数。它也可以接受一个函数,一个字符或数字矢量。
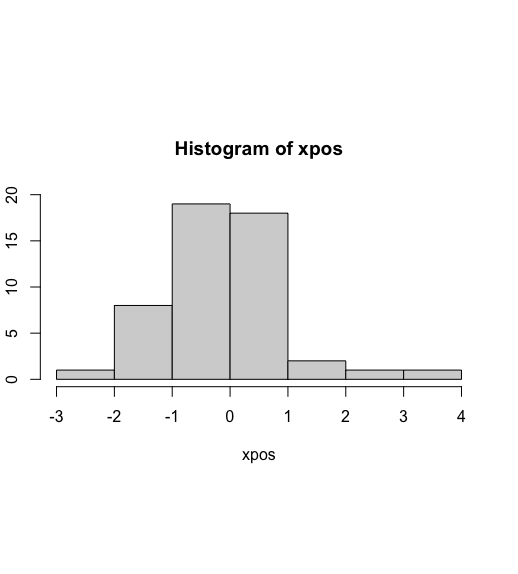
让我们先创建一个普通的直方图,这样区别就很明显了。
例子
# setting the seed value
set.seed(67832)

# define x values using the
# rnorm method
xpos <- rnorm(50)

# plotting the histogram
hist(xpos , ylim=c(0,20))
输出

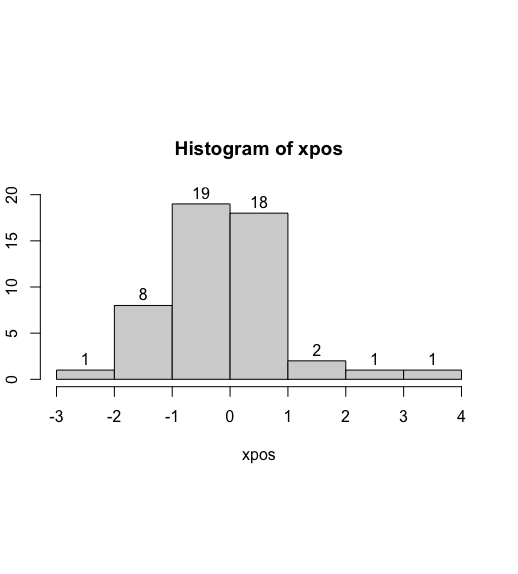
为了计算每个范围内遇到的数值的数量,可以将标签属性设置为TRUE。
语法
hist(..., labels=TRUE,...)
例子
# setting the seed value
set.seed(67832)

# define x values using the
# rnorm method
xpos <- rnorm(50)

# plotting the histogram
hist(xpos , labels = TRUE, ylim=c(0,20))
输出

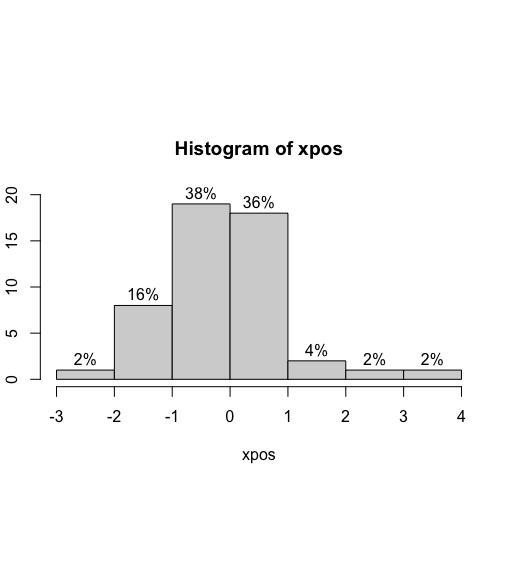
百分比可以用数学函数来计算。最初,没有任何标签的直方图被存储在一个变量中。可以使用提取的直方图变量的 counts 属性来访问其计数。这将返回一个整数向量的值,每个值都被输入数据向量的长度所除。这些值乘以100,变成十进制值。
可以使用R编程语言中的round()方法将小数点数值四舍五入到一个特定的数字。
语法
round(num , digits)
paste0()方法可以用来将数值连接在一起,并在相应的数值上附加一个”%”符号。在这个方法中,分隔符默认为空字符串。
语法
paste0(val , "%")
例子
# setting the seed value
set.seed(67832)

# define x values using the rnorm method
xpos <- rnorm(50)

# computing length of x labels
len <- length(xpos)

# drawing a histogram without labels
hist_init <- hist(xpos, plot = FALSE)

# round the percentage to two places
rounded <- round(hist_init$counts / len * 100, 2)

# drawing a histogram
# adding % symbol in the value
hist(xpos,
     labels = paste0(rounded , "%"), ylim=c(0,20))
输出

 极客教程
极客教程