R语言 如何使用Plotly使雷达图的线条变圆
雷达图是 用来用图形表示多变量独立数据的。这是一个圆形图表,每个独立变量都有自己的轴,所有这些轴都在雷达图的中心合并。它也被称为网络图,因为它看起来像蜘蛛网。当人们想分析独立变量之间的关系时,就会使用这种图表。在R编程中,可以使用plot_ly()函数来实现这一功能。
要安装和加载 plot_ly,请使用下面的命令。
install.packages("plotly")
library(plotly)
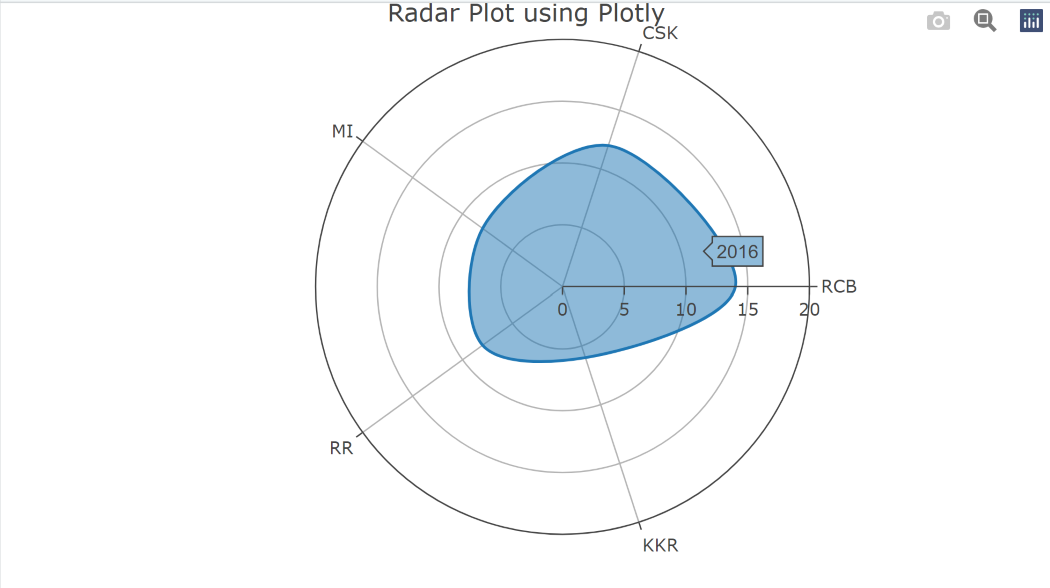
默认情况下,用于在雷达图中绘制数据的线条是线性的,为了使它们变得圆滑,我们必须在plot_ly()函数中指定线条形状为 花键。(数学中的花线被称为通过点的圆弧曲线)。
语法: plot_ly(type,mode,r,theta,fill,line,layout())
其中
- type – 用于设置绘图的类型(雷达图的scatterpolar)。
- mode – 用于指定绘图边界(线)的模式
- r – 包含要在轴的半径上绘制的点的向量
- theta – 根据提供给它的值的数量来划分雷达图的轴线
- line – 用于指定直线的类型,作为绘图的边界(花键)。
- layout() – 用来定制绘图的布局
现在,我们可以开始制作简单的雷达图了。
# Plotting the radar plot using plot_ly() function
fig <- plotly::plot_ly(
  type = 'scatterpolar',
  mode='lines',
  r = c(14,12,8,8,6,14),
  theta = c('RCB','CSK','MI','RR','KKR','RCB'),
  fill = 'toself',
  line = list(shape = 'spline'),
  name="2016"
)
# Specifying the layout of radar plot
fig <- fig %>% layout(polar=list(radialaxis =
                                 list(visible = T,range = c(0,20))),
                      title="Radar Plot using Plotly")
fig
输出

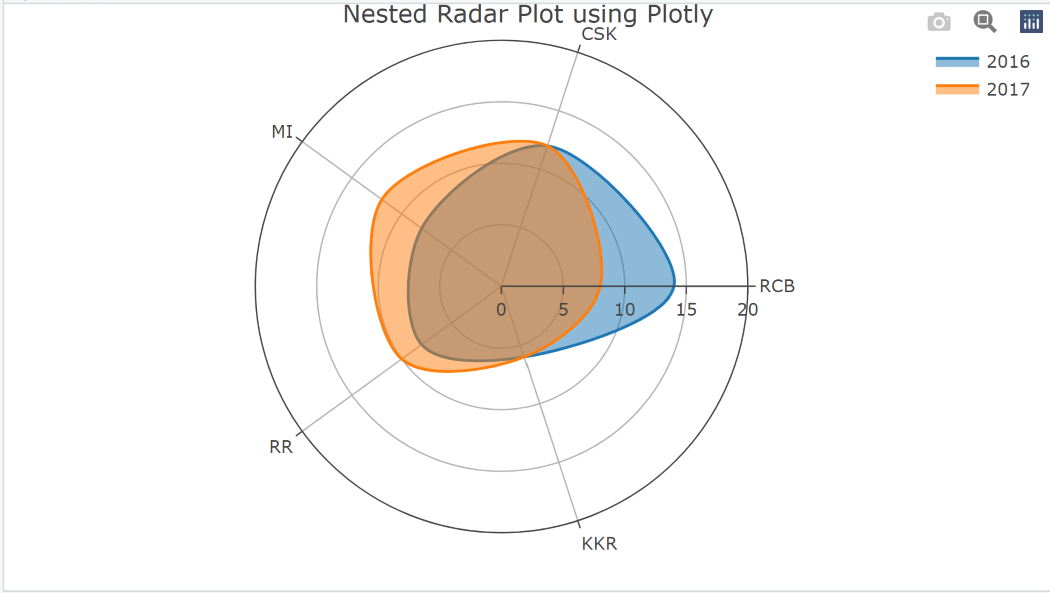
我们还可以为2个或更多的轨迹绘制嵌套雷达图。让我们看看相关的代码。
fig <- plotly::plot_ly(
  type = 'scatterpolar',
  mode='lines',
  r = c(14,12,8,8,6,14),
  theta = c('RCB','CSK','MI','RR','KKR','RCB'),
  fill = 'toself',
  line = list(shape = 'spline'),
  name="2016"
)
# Adding another trace to the plot
fig <- fig %>% add_trace(r = c(8,12,12,10,6,8),
                         theta = c('RCB','CSK','MI',
                                   'RR','KKR','RCB'),
                         fill = 'toself',
                         line = list(shape = 'spline'),
                         name="2017")
# Specifying the layout of radar plot
fig <- fig %>% layout(polar=list(radialaxis =
                                 list(visible = T,
                                      range = c(0,20))),
                      title="Nested Radar Plot using Plotly")
fig
输出

让我们定制雷达图的背景。
# Plotting the radar plot using plot_ly() function
fig <- plotly::plot_ly(
  type = 'scatterpolar',
  mode='lines',
  r = c(14,12,8,8,6,14),
  theta = c('RCB','CSK','MI','RR','KKR','RCB'),
  fill = 'toself',
  line = list(shape = 'spline'),
  name="2016")

# Specifying the layout of radar plot
fig <- fig %>% layout(polar=list(radialaxis = list(visible = T,
                                 range = c(0,20),gridcolor="blue",
                                   linecolor="red"),bgcolor="pink"),
                                   title="Customized Radar Plot using Plotly")
fig
输出

 极客教程
极客教程