R语言 如何在R中寻找置信区间
置信区间表示统计数据中存在多少不确定性。换句话说,它被定义为描述一个概率为1-α的人口参数的区间。置信区间的表达式如下。
x̄±tα / 2,N – 1 Sx̄
这里。
x̄±tα / 2 :它表示形成α / 2区域所需的值(T分布的每个尾部,其中
自由度 = n – 1)
Sx̄ = s / √n : 它表示平均值的标准误差。
在R中确定置信区间
首先,我们需要创建样本数据。R提供了内置的数据集。在这篇文章中,我们将使用鸢尾花数据集进行说明。鸢尾花数据集描述了以厘米为单位的萼片长度、萼片宽度、花瓣长度和花瓣宽度。它提供了三个鸢尾花品种中每个品种的50朵花的数据。这些物种是
- 鸢尾花Setosa
- 斑斓
- 维尔京花
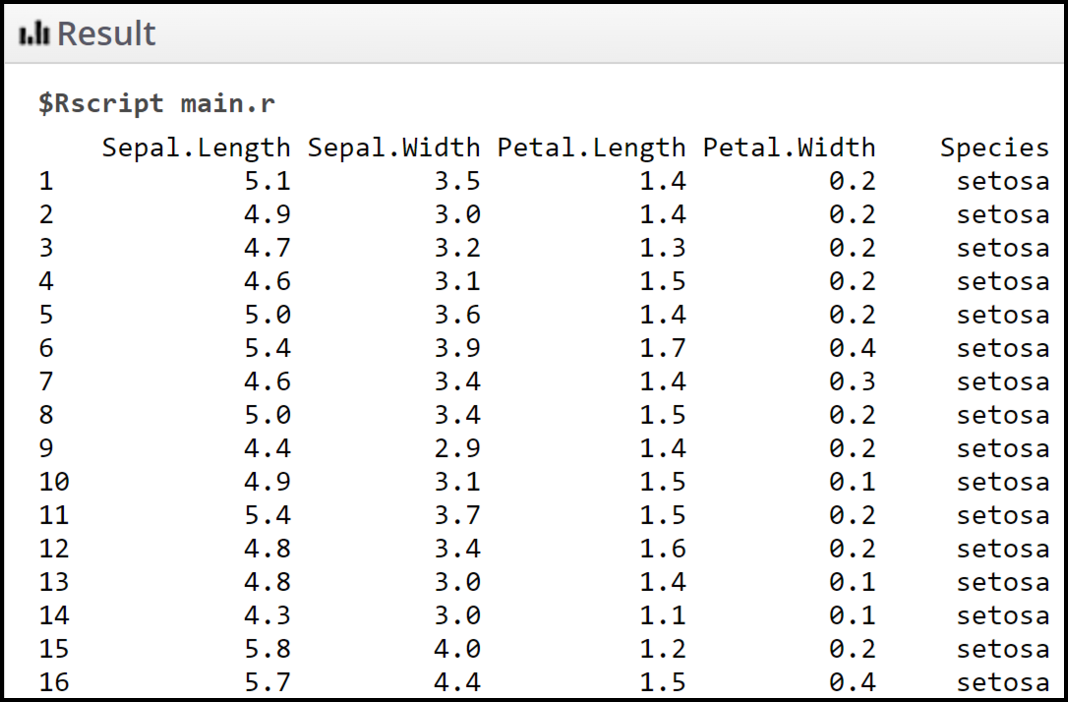
# Printing the contents of iris inbuilt dataset
print(iris)
输出 。

方法1:使用基础R计算区间
在这个方法中,我们将使用数学公式和R函数一步一步地找到置信区间。你可以按照下面的步骤在R中确定置信区间。
第1步: 计算平均值。第一步是确定给定样本数据的平均值。
# R program to determine the mean

# Calculate the mean of the Sepal.Length
mean_value <- mean(iris$Sepal.Length)
第2步: 现在我们来计算平均值的标准误差。
为了计算平均值的标准误差(Sx̄ ),我们需要找到标准差(s)和样本数据的长度(n)。
# Compute the size
n <- length(irisSepal.Length)

# Find the standard deviation
standard_deviation <- sd(irisSepal.Length)

# Find the standard error
standard_error <- standard_deviation / sqrt(n)
第3步: 确定与置信度相关的t分数。
在这一步,我们将计算与置信度有关的t分数。我们被要求在下尾和上尾都有确切的α/2概率。R提供了qt()函数,使用它我们可以很容易地计算出t分数。其语法如下。
语法 。
qt(random_variable, degree_of_freedom)
参数 。
random_variable。它必须是一个随机变量
自由度。必须是自由度
alpha = 0.05
degrees_of_freedom = sample.n - 1
t_score = qt(p=alpha/2, df=degrees_of_freedom,lower.tail=F)
print(t_score)
第4步: 计算误差率并形成置信区间。
误差率由以下公式给出。
tα / 2,N – 1 Sx̄
它可以很容易地计算为。
margin_error <- t_score * standard_error
置信区间等于平均值+/-误差率。它可以被计算为
# Calculate the lower bound
lower_bound <- mean_value - margin_error

# Calculate the upper bound
upper_bound <- mean_value + margin_error
结合所有的步骤
例子 。
# R program to find the confidence interval

# Calculate the mean of the sample data
mean_value <- mean(irisSepal.Length)

# Compute the size
n <- length(irisSepal.Length)

# Find the standard deviation
standard_deviation <- sd(iris$Sepal.Length)

# Find the standard error
standard_error <- standard_deviation / sqrt(n)
alpha = 0.05
degrees_of_freedom = n - 1
t_score = qt(p=alpha/2, df=degrees_of_freedom,lower.tail=F)
margin_error <- t_score * standard_error

# Calculating lower bound and upper bound
lower_bound <- mean_value - margin_error
upper_bound <- mean_value + margin_error

# Print the confidence interval
print(c(lower_bound,upper_bound))
输出 。

方法2:使用confint()函数计算置信区间
我们可以使用R中的内置函数计算置信区间,步骤如下。
步骤1: 计算平均数和标准误差。
R为我们提供了lm()函数,用于在数据框架中拟合线性模型。我们可以用这个函数来计算平均数和标准误差(这是寻找置信区间所需要的)。其语法如下。
语法 。
lm(fitting_formula, dataframe)
参数 。
fitting_formula。必须是线性模型的公式。
dataframe。必须是包含数据的数据框的名称。
# Calculate the mean and standard error
l_model <- lm(Sepal.Length ~ 1, iris)
第二步: 寻找置信区间。
现在,为了找到置信区间,我们在R中使用confint()函数。这个函数专门用来计算拟合模型中一个或多个参数的置信区间。其语法如下。
语法 。
confint(object, parm, level = 0.95, …)
参数 。
object。它代表拟合模型对象。
parm : 它代表要给出置信区间的参数(可以是一个向量)
level:它代表置信度。
… : 它代表不同方法的额外参数。
# Find the confidence interval

confint(model, level=0.95)
结合所有的步骤
例子 。
# R program to find the confidence interval

# Calculate the mean and standard error
model <- lm(Sepal.Length ~ 1, iris)

# Find the confidence interval
confint(model, level=0.95)
输出 。

 极客教程
极客教程